Gary King is the Weatherhead University Professor at Harvard University. He also serves as Director of the Institute for Quantitative Social Science. He and his research group develop and apply empirical methods in many areas of social science research.

Research Areas
Anchoring Vignettes (for interpersonal incomparability) 🔗
Methods for interpersonal incomparability, when respondents (from different cultures, genders, countries, or ethnic groups) understand survey questions in different ways; for developing theoretical definitions of complicated concepts apparently definable only by example (i.e., "you know it when you see it").
- Jonathan Wand, Gary King, Olivia Lau. 2011. "Anchors: Software for Anchoring Vignettes Data." Journal of Statistical Software, 42, 3, Pp. 1-25.Article Code Publisher's Version
+ Abstract
When respondents use the ordinal response categories of standard survey questions in different ways, the validity of analyses based on the resulting data can be biased. Anchoring vignettes is a survey design technique intended to correct for some of these problems. The anchors package in R includes methods for evaluating and choosing anchoring vignettes, and for analyzing the resulting data. - Daniel Hopkins, Gary King. 2010. "Improving Anchoring Vignettes: Designing Surveys to Correct Interpersonal Incomparability." Public Opinion Quarterly, 74, 2, Pp. 201–222.Article
+ Abstract
We report the results of several randomized survey experiments designed to evaluate two intended improvements to anchoring vignettes, an increasingly common technique used to achieve interpersonal comparability in survey research. This technique asks for respondent self-assessments followed by assessments of hypothetical people described in vignettes. Variation in assessments of the vignettes across respondents reveals interpersonal incomparability and allows researchers to make responses more comparable by rescaling them. Our experiments show, first, that switching the question order so that self-assessments follow the vignettes primes respondents to define the response scale in a common way. In this case, priming is not a bias to avoid but a means of better communicating the question’s meaning. We then demonstrate that combining vignettes and self-assessments in a single direct comparison induces inconsistent and less informative responses. Since similar combined strategies are widely employed for related purposes, our results indicate that anchoring vignettes could reduce measurement error in many applications where they are not currently used. Data for our experiments come from a national telephone survey and a separate on-line survey.
Replication data at the Harvard Dataverse: https://doi.org/10.7910/DVN/UU5EUI.
- Jonathan Wand, Gary King, Olivia Lau. 2007. "Anchors: Software for Anchoring Vignettes Data."
+ Abstract
When respondents use the ordinal response categories of standard survey questions in different ways, the validity of analyses based on the resulting data can be biased. Anchoring vignettes is a survey design technique intended to correct for some of these problems. The anchors package in R includes methods for evaluating and choosing anchoring vignettes, and for analyzing the resulting data. - Gary King, Jonathan Wand. 2007. "Comparing Incomparable Survey Responses: New Tools for Anchoring Vignettes." Political Analysis, 15, 1, Pp. 46–66.Article
+ Abstract
When respondents use the ordinal response categories of standard survey questions in different ways, the validity of analyses based on the resulting data can be biased. Anchoring vignettes is a survey design technique, introduced by King, Murray, Salomon, and Tandon (2004), intended to correct for some of these problems. We develop new methods both for evaluating and choosing anchoring vignettes, and for analyzing the resulting data. With surveys on a diverse range of topics in a range of countries, we illustrate how our proposed methods can improve the ability of anchoring vignettes to extract information from survey data, as well as saving in survey administration costs. - Gary King, Christopher J.L. Murray, Joshua A. Salomon, Ajay Tandon. 2004. "Enhancing the Validity and Cross-Cultural Comparability of Measurement in Survey Research." American Political Science Review, 98, Pp. 191–207.Article
+ Abstract
We address two long-standing survey research problems: measuring complicated concepts, such as political freedom or efficacy, that researchers define best with reference to examples and and what to do when respondents interpret identical questions in different ways. Scholars have long addressed these problems with approaches to reduce incomparability, such as writing more concrete questions – with uneven success. Our alternative is to measure directly response category incomparability and to correct for it. We measure incomparability via respondents’ assessments, on the same scale as the self-assessments to be corrected, of hypothetical individuals described in short vignettes. Since actual levels of the vignettes are invariant over respondents, variability in vignette answers reveals incomparability. Our corrections require either simple recodes or a statistical model designed to save survey administration costs. With analysis, simulations, and cross-national surveys, we show how response incomparability can drastically mislead survey researchers and how our approach can fix them.
Automated Text Analysis 🔗
Automated and computer-assisted methods of extracting, organizing, understanding, conceptualizing, and consuming knowledge from massive quantities of unstructured text.
Content Analysis
- Queenie Luo, Gary King, Michael Puett, Michael D. Smith. 2026. "Inducing Sustained Creativity and Diversity in Large Language Models."Article Appendix
+ Abstract
We address a not-widely-recognized subset of exploratory search, where a user sets out on a typically long “search quest” for the perfect wedding dress, overlooked research topic, killer company idea, etc. The first few outputs of current large language models (LLMs) may be helpful but only as a start, since the quest requires learning the search space and evaluating many diverse and creative alternatives along the way. Although LLMs encode an impressive fraction of the world’s knowledge, common decoding methods are narrowly optimized for prompts with correct answers and thus return mostly homogeneous and conventional results. Other approaches, including those designed to increase diversity across a small set of answers, start to repeat themselves long before search quest users learn enough to make final choices, or offer a uniform type of “creativity” to every user asking similar questions. We develop a novel, easy-to-implement decoding scheme that induces sustained creativity and diversity in LLMs, producing as many conceptually unique results as desired, even without access to the inner workings of an LLM’s vector space. The algorithm unlocks an LLM’s vast knowledge, both orthodox and heterodox, well beyond modal decoding paths. With this approach, search quest users can more quickly explore the search space and find satisfying answers. - Connor T. Jerzak, Gary King, Anton Strezhnev. 2022. "An Improved Method of Automated Nonparametric Content Analysis for Social Science." Political Analysis, 31, 1, Pp. 42–58.Article Appendix
+ Abstract
Some scholars build models to classify documents into chosen categories. Others, especially social scientists who tend to focus on population characteristics, instead usually estimate the proportion of documents in each category – using either parametric “classify-and-count” methods or “direct” nonparametric estimation of proportions without individual classification. Unfortunately, classify-and-count methods can be highly model dependent or generate more bias in the proportions even as the percent of documents correctly classified increases. Direct estimation avoids these problems, but can suffer when the meaning of language changes between training and test sets or is too similar across categories. We develop an improved direct estimation approach without these issues by including and optimizing continuous text features, along with a form of matching adapted from the causal inference literature. Our approach substantially improves performance in a diverse collection of 73 data sets. We also offer easy-to-use software software that implements all ideas discussed herein.
Replication data at the Harvard Dataverse: https://doi.org/10.7910/DVN/AVNZR6.
- David M. J. Lazer, Alex Pentland, Duncan J. Watts, Sinan Aral, Susan Athey, Noshir Contractor, Deen Freelon, Sandra Gonzalez-Bailon, Gary King, Helen Margetts, Alondra Nelson, Matthew J. Salganik, Markus Strohmaier, Alessandro Vespignani, Claudia Wagner. 2020. "Computational Social Science: Obstacles and Opportunities." Science, 369, 6507, Pp. 1060–1062.Article Publisher's Version
+ Abstract
The field of computational social science (CSS) has exploded in prominence over the past decade, with thousands of papers published using observational data, experimental designs, and large-scale simulations that were once unfeasible or unavailable to researchers. These studies have greatly improved our understanding of important phenomena, ranging from social inequality to the spread of infectious diseases. The institutions supporting CSS in the academy have also grown substantially, as evidenced by the proliferation of conferences, workshops, and summer schools across the globe, across disciplines, and across sources of data. But the field has also fallen short in important ways. Many institutional structures around the field—including research ethics, pedagogy, and data infrastructure—are still nascent. We suggest opportunities to address these issues, especially in improving the alignment between the organization of the 20th-century university and the intellectual requirements of the field. - Gary King. 2020. "The SilverLining Project: Finding Social Good in Clouds on the Dark Web."Site
+ Abstract
Overview. Wave after wave of increasingly spectacular data breaches are exposing personal information about billions of people, companies, countries, and other organizations around the world. The dark web includes some of this information and every manner of other content — legal and illegal, ethical and unethical, innocuous and offensive, authentic and fraudulent. The damage these activities are causing is well known. What is not known, and what we are now studying, is whether we might be able to find a silver lining in these dark clouds by creating some social good out of all this chaos. If you know of data or information like this that might be useful for academic research, we would appreciate hearing from you. - Gary King, Patrick Lam, Margaret Roberts. 2017. "Computer-Assisted Keyword and Document Set Discovery from Unstructured Text." American Journal of Political Science, 61, 4, Pp. 971–988.Article Publisher's Version
+ Abstract
The (unheralded) first step in many applications of automated text analysis involves selecting keywords to choose documents from a large text corpus for further study. Although all substantive results depend on this choice, researchers usually pick keywords in ad hoc ways that are far from optimal and usually biased. Paradoxically, this often means that the validity of the most sophisticated text analysis methods depend in practice on the inadequate keyword counting or matching methods they are designed to replace. Improved methods of keyword selection would also be valuable in many other areas, such as following conversations that rapidly innovate language to evade authorities, seek political advantage, or express creativity; generic web searching; eDiscovery; look-alike modeling; intelligence analysis; and sentiment and topic analysis. We develop a computer-assisted (as opposed to fully automated) statistical approach that suggests keywords from available text without needing structured data as inputs. This framing poses the statistical problem in a new way, which leads to a widely applicable algorithm. Our specific approach is based on training classifiers, extracting information from (rather than correcting) their mistakes, and summarizing results with Boolean search strings. We illustrate how the technique works with analyses of English texts about the Boston Marathon Bombings, Chinese social media posts designed to evade censorship, among others. - Gary King, Jennifer Pan, Margaret E. Roberts. 2014. "Reverse-Engineering Censorship in China: Randomized Experimentation and Participant Observation." Science, 345, 6199, Pp. 1251722.Article Publisher's Version Appendix
+ Abstract
Existing research on the extensive Chinese censorship organization uses observational methods with well-known limitations. We conducted the first large-scale experimental study of censorship by creating accounts on numerous social media sites, randomly submitting different texts, and observing from a worldwide network of computers which texts were censored and which were not. We also supplemented interviews with confidential sources by creating our own social media site, contracting with Chinese firms to install the same censoring technologies as existing sites, and—with their software, documentation, and even customer support—reverse-engineering how it all works. Our results offer rigorous support for the recent hypothesis that criticisms of the state, its leaders, and their policies are published, whereas posts about real-world events with collective action potential are censored.
Replication data at the Harvard Dataverse: https://doi.org/10.7910/DVN/26212.
- Justin Grimmer, Gary King, Chiara Superti. 2014. "You Lie! Patterns of Partisan Taunting in the U.S. Senate (Poster)." In Society for Political Methodology. Athens, GA.Poster
+ Abstract
This is a poster that describes our analysis of “partisan taunting,” the explicit, public, and negative attacks on another political party or its members, usually using vitriolic and derogatory language. We first demonstrate that most projects that hand code text in the social sciences optimize with respect to the wrong criterion, resulting in large, unnecessary biases. We show how to fix this problem and then apply it to taunting. We find empirically that, unlike most claims in the press and the literature, taunting is not inexorably increasing; it appears instead to be a rational political strategy, most often used by those least likely to win by traditional means – ideological extremists, out-party members when the president is unpopular, and minority party members. However, although taunting appears to be individually rational, it is collectively irrational: Constituents may resonate with one cutting taunt by their Senator, but they might not approve if he or she were devoting large amounts of time to this behavior rather than say trying to solve important national problems. We hope to partially rectify this situation by posting public rankings of Senatorial taunting behavior. - Gary King, Jennifer Pan, Margaret E. Roberts. 2013. "How Censorship in China Allows Government Criticism But Silences Collective Expression." American Political Science Review, 107, 2, Pp. 326–343.Article
+ Abstract
We offer the first large scale, multiple source analysis of the outcome of what may be the most extensive effort to selectively censor human expression ever implemented. To do this, we have devised a system to locate, download, and analyze the content of millions of social media posts originating from nearly 1,400 different social media services all over China before the Chinese government is able to find, evaluate, and censor (i.e., remove from the Internet) the large subset they deem objectionable. Using modern computer-assisted text analytic methods that we adapt to and validate in the Chinese language, we compare the substantive content of posts censored to those not censored over time in each of 85 topic areas. Contrary to previous understandings, posts with negative, even vitriolic, criticism of the state, its leaders, and its policies are not more likely to be censored. Instead, we show that the censorship program is aimed at curtailing collective action by silencing comments that represent, reinforce, or spur social mobilization, regardless of content. Censorship is oriented toward attempting to forestall collective activities that are occurring now or may occur in the future — and, as such, seem to clearly expose government intent.
Replication data at the Harvard Dataverse: https://doi.org/10.7910/DVN1/22691.
- Justin Grimmer, Gary King. 2011. "General Purpose Computer-Assisted Clustering and Conceptualization." Proceedings of the National Academy of Sciences, 108, 7, Pp. 2643–2650.Article Publisher's Version Appendix
+ Abstract
We develop a computer-assisted method for the discovery of insightful conceptualizations, in the form of clusterings (i.e., partitions) of input objects. Each of the numerous fully automated methods of cluster analysis proposed in statistics, computer science, and biology optimize a different objective function. Almost all are well defined, but how to determine before the fact which one, if any, will partition a given set of objects in an “insightful” or “useful” way for a given user is unknown and difficult, if not logically impossible. We develop a metric space of partitions from all existing cluster analysis methods applied to a given data set (along with millions of other solutions we add based on combinations of existing clusterings), and enable a user to explore and interact with it, and quickly reveal or prompt useful or insightful conceptualizations. In addition, although uncommon in unsupervised learning problems, we offer and implement evaluation designs that make our computer-assisted approach vulnerable to being proven suboptimal in specific data types. We demonstrate that our approach facilitates more efficient and insightful discovery of useful information than either expert human coders or many existing fully automated methods. - Daniel Hopkins, Gary King. 2010. "A Method of Automated Nonparametric Content Analysis for Social Science." American Journal of Political Science, 54, 1, Pp. 229–247.Article
+ Abstract
The increasing availability of digitized text presents enormous opportunities for social scientists. Yet hand coding many blogs, speeches, government records, newspapers, or other sources of unstructured text is infeasible. Although computer scientists have methods for automated content analysis, most are optimized to classify individual documents, whereas social scientists instead want generalizations about the population of documents, such as the proportion in a given category. Unfortunately, even a method with a high percent of individual documents correctly classified can be hugely biased when estimating category proportions. By directly optimizing for this social science goal, we develop a method that gives approximately unbiased estimates of category proportions even when the optimal classifier performs poorly. We illustrate with diverse data sets, including the daily expressed opinions of thousands of people about the U.S. presidency. We also make available software that implements our methods and large corpora of text for further analysis. This article led to the formation of Crimson Hexagon. - Gary King, Will Lowe. 2003. "An Automated Information Extraction Tool For International Conflict Data With Performance As Good As Human Coders: A Rare Events Evaluation Design." International Organization, 57, Pp. 617-42.Article
+ Abstract
Despite widespread recognition that aggregated summary statistics on international conflict and cooperation miss most of the complex interactions among nations, the vast majority of scholars continue to employ annual, quarterly, or occasionally monthly observations. Daily events data, coded from some of the huge volume of news stories produced by journalists, have not been used much for the last two decades. We offer some reason to change this practice, which we feel should lead to considerably increased use of these data. We address advances in event categorization schemes and software programs that automatically produce data by “reading” news stories without human coders. We design a method that makes it feasible for the first time to evaluate these programs when they are applied in areas with the particular characteristics of international conflict and cooperation data, namely event categories with highly unequal prevalences, and where rare events (such as highly conflictual actions) are of special interest. We use this rare events design to evaluate one existing program, and find it to be as good as trained human coders, but obviously far less expensive to use. For large scale data collections, the program dominates human coding. Our new evaluative method should be of use in international relations, as well as more generally in the field of computational linguistics, for evaluating other automated information extraction tools. We believe that the data created by programs similar to the one we evaluated should see dramatically increased use in international relations research. To facilitate this process, we are releasing with this article data on 4.3 million international events, covering the entire world for the last decade. - Will Lowe, Gary King. 2003. "Some Statistical Methods for Evaluating Information Extraction Systems." Proceedings of the 10th Conference of the European Chapter of the Association for Computational Linguistics, Pp. 19-26.Article
+ Abstract
We present new statistical methods for evaluating information extraction systems. The methods were developed to evaluate a system used by political scientists to extract event information from news leads about international politics. The nature of this data presents two problems for evaluators: 1) the frequency distribution of event types in international event data is strongly skewed, so a random sample of newsleads will typically fail to contain any low frequency events. 2) Manual information extraction necessary to create evaluation sets is costly, and most effort is wasted coding high frequency categories . We present an evaluation scheme that overcomes these problems with considerably less manual effort than traditional methods, and also allows us to interpret an information extraction system as an estimator (in the statistical sense) and to estimate its bias.
Software
- Gary King, Matthew Knowles, Steven Melendez. 2010. "ReadMe: Software for Automated Content Analysis."
+ Abstract
This program will read and analyze a large set of text documents and report on the proportion of documents in each of a set of given categories.
Data
- Gary King. 2003. "10 Million International Dyadic Events."
Causal Inference 🔗
Methods for detecting and reducing model dependence (i.e., when minor model changes produce substantively different inferences) in inferring causal effects and other counterfactuals. Matching methods; "politically robust" and cluster-randomized experimental designs; causal bias decompositions.
Evaluating Model Dependence
- Gary King, Langche Zeng. 2009. "Empirical versus Theoretical Claims about Extreme Counterfactuals: A Response." Political Analysis, 17, Pp. 107-12.Article
+ Abstract
In response to the data-based measures of model dependence proposed in King and Zeng (2006), Sambanis and Michaelides (2008) propose alternative measures that rely upon assumptions untestable in observational data. If these assumptions are correct, then their measures are appropriate and ours, based solely on the empirical data, may be too conservative. If instead and as is usually the case, the researcher is not certain of the precise functional form of the data generating process, the distribution from which the data are drawn, and the applicability of these modeling assumptions to new counterfactuals, then the data-based measures proposed in King and Zeng (2006) are much preferred. After all, the point of model dependence checks is to verify empirically, rather than to stipulate by assumption, the effects of modeling assumptions on counterfactual inferences.
Replication data at the Harvard Dataverse: https://doi.org/10.7910/DVN/VL7QMO.
- Gary King, Langche Zeng. 2007. "When Can History Be Our Guide? The Pitfalls of Counterfactual Inference." International Studies Quarterly, Pp. 183-210.Article
+ Abstract
Inferences about counterfactuals are essential for prediction, answering “what if” questions, and estimating causal effects. However, when the counterfactuals posed are too far from the data at hand, conclusions drawn from well-specified statistical analyses become based on speculation and convenient but indefensible model assumptions rather than empirical evidence. Unfortunately, standard statistical approaches assume the veracity of the model rather than revealing the degree of model-dependence, and so this problem can be hard to detect. We develop easy-to-apply methods to evaluate counterfactuals that do not require sensitivity testing over specified classes of models. If an analysis fails the tests we offer, then we know that substantive results are sensitive to at least some modeling choices that are not based on empirical evidence. We use these methods to evaluate the extensive scholarly literatures on the effects of changes in the degree of democracy in a country (on any dependent variable) and separate analyses of the effects of UN peacebuilding efforts. We find evidence that many scholars are inadvertently drawing conclusions based more on modeling hypotheses than on their data. For some research questions, history contains insufficient information to be our guide.
Replication data at the Harvard Dataverse: https://doi.org/10.7910/DVN/EK886K.
- Gary King, Langche Zeng. 2007. "Detecting Model Dependence in Statistical Inference: A Response." International Studies Quarterly, 51, Pp. 231-41.Article
+ Abstract
Inferences about counterfactuals are essential for prediction, answering “what if” questions, and estimating causal effects. However, when the counterfactuals posed are too far from the data at hand, conclusions drawn from well-specified statistical analyses become based on speculation and convenient but indefensible model assumptions rather than empirical evidence. Unfortunately, standard statistical approaches assume the veracity of the model rather than revealing the degree of model-dependence, and so this problem can be hard to detect. We develop easy-to-apply methods to evaluate counterfactuals that do not require sensitivity testing over specified classes of models. If an analysis fails the tests we offer, then we know that substantive results are sensitive to at least some modeling choices that are not based on empirical evidence. We use these methods to evaluate the extensive scholarly literatures on the effects of changes in the degree of democracy in a country (on any dependent variable) and separate analyses of the effects of UN peacebuilding efforts. We find evidence that many scholars are inadvertently drawing conclusions based more on modeling hypotheses than on their data. For some research questions, history contains insufficient information to be our guide.
Replication data at the Harvard Dataverse: https://doi.org/10.7910/DVN/O2NXPE.
- Gary King, Langche Zeng. 2006. "The Dangers of Extreme Counterfactuals." Political Analysis, 14, 2, Pp. 131–159.Article
+ Abstract
We address the problem that occurs when inferences about counterfactuals – predictions, “what if” questions, and causal effects – are attempted far from the available data. The danger of these extreme counterfactuals is that substantive conclusions drawn from statistical models that fit the data well turn out to be based largely on speculation hidden in convenient modeling assumptions that few would be willing to defend. Yet existing statistical strategies provide few reliable means of identifying extreme counterfactuals. We offer a proof that inferences farther from the data are more model-dependent, and then develop easy-to-apply methods to evaluate how model-dependent our answers would be to specified counterfactuals. These methods require neither sensitivity testing over specified classes of models nor evaluating any specific modeling assumptions. If an analysis fails the simple tests we offer, then we know that substantive results are sensitive to at least some modeling choices that are not based on empirical evidence.
Replication data at the Harvard Dataverse: https://doi.org/10.7910/DVN/MJ1YCL.
Matching Methods
- Stefano M. Iacus, Gary King, Giuseppe Porro. 2019. "A Theory of Statistical Inference for Matching Methods in Causal Research." Political Analysis, 27, 1, Pp. 46–68.Article
+ Abstract
Researchers who generate data often optimize efficiency and robustness by choosing stratified over simple random sampling designs. Yet, all theories of inference proposed to justify matching methods are based on simple random sampling. This is all the more troubling because, although these theories require exact matching, most matching applications resort to some form of ex post stratification (on a propensity score, distance metric, or the covariates) to find approximate matches, thus nullifying the statistical properties these theories are designed to ensure. Fortunately, the type of sampling used in a theory of inference is an axiom, rather than an assumption vulnerable to being proven wrong, and so we can replace simple with stratified sampling, so long as we can show, as we do here, that the implications of the theory are coherent and remain true. Properties of estimators based on this theory are much easier to understand and can be satisfied without the unattractive properties of existing theories, such as assumptions hidden in data analyses rather than stated up front, asymptotics, unfamiliar estimators, and complex variance calculations. Our theory of inference makes it possible for researchers to treat matching as a simple form of preprocessing to reduce model dependence, after which all the familiar inferential techniques and uncertainty calculations can be applied. This theory also allows binary, multicategory, and continuous treatment variables from the outset and straightforward extensions for imperfect treatment assignment and different versions of treatments. - Gary King, Richard Nielsen. 2019. "Why Propensity Scores Should Not Be Used for Matching." Political Analysis, 27, 4, Pp. 435–454.Article Publisher's Version Appendix
+ Abstract
This talk summarizes a paper – Gary King and Richard Nielsen. 2015. “Why Propensity Scores Should Not Be Used for Matching” – with this abstract: Researchers use propensity score matching (PSM) as a data preprocessing step to selectively prune units prior to applying a model to estimate a causal effect. The goal of PSM is to reduce imbalance in the chosen pre-treatment covariates between the treated and control groups, thereby reducing the degree of model dependence and potential for bias. We show here that PSM often accomplishes the opposite of what is intended — increasing imbalance, inefficiency, model dependence, and bias. The weakness of PSM is that it attempts to approximate a completely randomized experiment, rather than, as with other matching methods, a more powerful fully blocked randomized experiment. PSM, unlike other matching methods, is thus blind to the often large portion of imbalance that could have been eliminated by approximating full blocking. Moreover, in data balanced enough to approximate complete randomization, either to begin with or after pruning some observations, PSM approximates random matching which turns out to increase imbalance. For other matching methods, the point where additional pruning increases imbalance occurs much later in the pruning process, when full blocking is approximated and there is no reason to prune, and so the danger is considerably less. We show that these problems with PSM occur even in data designed for PSM, with as few as two covariates, and in many real applications. Although these results suggest that researchers replace PSM with one of the other available methods when performing matching, propensity scores have many other productive uses.
See also related work.
- Gary King, Christopher Lucas, Richard Nielsen. 2017. "The Balance-Sample Size Frontier in Matching Methods for Causal Inference." American Journal of Political Science, 61, 2, Pp. 473–489.Article Appendix
+ Abstract
We propose a simplified approach to matching for causal inference that simultaneously optimizes both balance (between the treated and control groups) and matched sample size. This procedure resolves two widespread (bias-variance trade off-related) tensions in the use of this powerful and popular methodology. First, current practice is to run a matching method that maximizes one balance metric (such as a propensity score or average Mahalanobis distance), but then to check whether it succeeds with respect to a different balance metric for which it was not designed (such as differences in means or L1). Second, current matching methods either fix the sample size and maximize balance (e.g., Mahalanobis or propensity score matching), fix balance and maximize the sample size (such as coarsened exact matching), or are arbitrary compromises between the two (such as calipers with ad hoc thresholds applied to other methods). These tensions lead researchers to either try to optimize manually, by iteratively tweaking their matching method and rechecking balance, or settle for suboptimal solutions. We address these tensions by first defining the matching frontier as the set of matching solutions with maximum balance for each possible sample size. Researchers can then choose one, several, or all matching solutions from the frontier for analysis in one step without iteration. The main difficulty in this strategy is that checking all possible solutions is exponentially difficult. We solve this problem with new algorithms that finish fast and require no iteration or manual tweaking. We also offer easy-to-use software that implements these ideas, along with several empirical applications. This talk is based in part on this paper with Christopher Lucas and Richard Nielsen. - Stefano M. Iacus, Gary King, Giuseppe Porro. 2012. "Causal Inference Without Balance Checking: Coarsened Exact Matching." Political Analysis, 20, 1, Pp. 1–24.Article Publisher's Version
+ Abstract
We discuss a method for improving causal inferences called “Coarsened Exact Matching’’ (CEM), and the new “Monotonic Imbalance Bounding’’ (MIB) class of matching methods from which CEM is derived. We summarize what is known about CEM and MIB, derive and illustrate several new desirable statistical properties of CEM, and then propose a variety of useful extensions. We show that CEM possesses a wide range of desirable statistical properties not available in most other matching methods, but is at the same time exceptionally easy to comprehend and use. We focus on the connection between theoretical properties and practical applications. We also make available easy-to-use open source software for R and Stata which implement all our suggestions.
See also An Explanation of CEM Weights.
- Gary King, Richard Nielsen, Carter Coberley, James E. Pope, Aaron Wells. 2011. "Comparative Effectiveness of Matching Methods for Causal Inference."Article
+ Abstract
Matching is an increasingly popular method of causal inference in observational data, but following methodological best practices has proven difficult for applied researchers. We address this problem by providing a simple graphical approach for choosing among the numerous possible matching solutions generated by three methods: the venerable “Mahalanobis Distance Matching” (MDM), the commonly used “Propensity Score Matching” (PSM), and a newer approach called “Coarsened Exact Matching” (CEM). In the process of using our approach, we also discover that PSM often approximates random matching, both in many real applications and in data simulated by the processes that fit PSM theory. Moreover, contrary to conventional wisdom, random matching is not benign: it (and thus PSM) can often degrade inferences relative to not matching at all. We find that MDM and CEM do not have this problem, and in practice CEM usually outperforms the other two approaches. However, with our comparative graphical approach and easy-to-follow procedures, focus can be on choosing a matching solution for a particular application, which is what may improve inferences, rather than the particular method used to generate it.
Please see our follow up paper on this topic: Why Propensity Scores Should Not Be Used for Matching.
- Daniel E. Ho, Kosuke Imai, Gary King, Elizabeth A. Stuart. 2011. "MatchIt: Nonparametric Preprocessing for Parametric Causal Inference." Journal of Statistical Software, 42, 8, Pp. 1-28.Article Publisher's Version
+ Abstract
MatchIt implements the suggestions of Ho, Imai, King, and Stuart (2007) for improving parametric statistical models by preprocessing data with nonparametric matching methods. MatchIt implements a wide range of sophisticated matching methods, making it possible to greatly reduce the dependence of causal inferences on hard-to-justify, but commonly made, statistical modeling assumptions. The software also easily fits into existing research practices since, after preprocessing data with MatchIt, researchers can use whatever parametric model they would have used without MatchIt, but produce inferences with substantially more robustness and less sensitivity to modeling assumptions. MatchIt is an R program, and also works seamlessly with Zelig. - Stefano M. Iacus, Gary King, Giuseppe Porro. 2011. "Multivariate Matching Methods That Are Monotonic Imbalance Bounding." Journal of the American Statistical Association, 106, 493, Pp. 345–361.Article
+ Abstract
We introduce a new “Monotonic Imbalance Bounding” (MIB) class of matching methods for causal inference with a surprisingly large number of attractive statistical properties. MIB generalizes and extends in several new directions the only existing class, “Equal Percent Bias Reducing” (EPBR), which is designed to satisfy weaker properties and only in expectation. We also offer strategies to obtain specific members of the MIB class, and analyze in more detail a member of this class, called Coarsened Exact Matching, whose properties we analyze from this new perspective. We offer a variety of analytical results and numerical simulations that demonstrate how members of the MIB class can dramatically improve inferences relative to EPBR-based matching methods.
Replication data at the Harvard Dataverse: https://doi.org/10.7910/DVN/OMHQFP.
- Matthew Blackwell, Stefano Iacus, Gary King, Giuseppe Porro. 2009. "CEM: Coarsened Exact Matching in Stata." The Stata Journal, 9(4), 524–546.Article Publisher's Version
+ Abstract
In this article, we introduce a Stata implementation of coarsened exact matching, a new method for improving the estimation of causal effects by reducing imbalance in covariates between treated and control groups. Coarsened exact matching is faster, is easier to use and understand, requires fewer assumptions, is more easily automated, and possesses more attractive statistical properties for many applications than do existing matching methods. In coarsened exact matching, users temporarily coarsen their data, exact match on these coarsened data, and then run their analysis on the uncoarsened, matched data. Coarsened exact matching bounds the degree of model dependence and causal effect estimation error by ex ante user choice, is monotonic imbalance bounding (so that reducing the maximum imbalance on one variable has no effect on others), does not require a separate procedure to restrict data to common support, meets the congruence principle, is approximately invariant to measurement error, balances all nonlinearities and interactions in sample (i.e., not merely in expectation), and works with multiply imputed datasets. Other matching methods inherit many of the coarsened exact matching method’s properties when applied to further match data preprocessed by coarsened exact matching. The cem command implements the coarsened exact matching algorithm in Stata. - Stefano Iacus, Gary King, Giuseppe Porro. 2009. "CEM: Software for Coarsened Exact Matching." Journal of Statistical Software, 30(9).Article Publisher's Version Publisher's Version
+ Abstract
This program is designed to improve causal inference via a method of matching that is widely applicable in observational data and easy to understand and use (if you understand how to draw a histogram, you will understand this method). The program implements the coarsened exact matching (CEM) algorithm, described below. CEM may be used alone or in combination with any existing matching method. This algorithm, and its statistical properties, are described in Iacus, King, and Porro (2008). - Daniel Ho, Kosuke Imai, Gary King, Elizabeth Stuart. 2007. "Matching As Nonparametric Preprocessing for Reducing Model Dependence in Parametric Causal Inference." Political Analysis, 15, 3, Pp. 199–236.Article
+ Abstract
Although published works rarely include causal estimates from more than a few model specifications, authors usually choose the presented estimates from numerous trial runs readers never see. Given the often large variation in estimates across choices of control variables, functional forms, and other modeling assumptions, how can researchers ensure that the few estimates presented are accurate or representative? How do readers know that publications are not merely demonstrations that it ispossibleto find a specification that fits the author’s favorite hypothesis? And how do we evaluate or even define statistical properties like unbiasedness or mean squared error when no unique model or estimator even exists? Matching methods, which offer the promise of causal inference with fewer assumptions, constitute one possible way forward, but crucial results in this fast-growing methodological literature are often grossly misinterpreted. We explain how to avoid these misinterpretations and propose a unified approach that makes it possible for researchers to preprocess data with matching (such as with the easy-to-use software we offer) and then to apply the best parametric techniques they would have used anyway. This procedure makes parametric models produce more accurate and considerably less model-dependent causal inferences. Winner of the Warren Miller Prizefor the best article published in Political Analysis. Also winner of the Fast Breaking Paper, for the article with the largest percentage increase in citations among those in the top 1% of total citations across the social sciences in the last two years by Thomson Reuters’ ScienceWatch, 2008.
Replication data at the Harvard Dataverse: https://doi.org/10.7910/DVN/RWUY8G.
Additional Approaches
- Kosuke Imai, Gary King, Elizabeth Stuart. 2008. "Misunderstandings Among Experimentalists and Observationalists about Causal Inference." Journal of the Royal Statistical Society, Series A, 171, part 2, Pp. 481–502.Article
+ Abstract
We attempt to clarify, and suggest how to avoid, several serious misunderstandings about and fallacies of causal inference in experimental and observational research. These issues concern some of the most basic advantages and disadvantages of each basic research design. Problems include improper use of hypothesis tests for covariate balance between the treated and control groups, and the consequences of using randomization, blocking before randomization, and matching after treatment assignment to achieve covariate balance. Applied researchers in a wide range of scientific disciplines seem to fall prey to one or more of these fallacies, and as a result make suboptimal design or analysis choices. To clarify these points, we derive a new four-part decomposition of the key estimation errors in making causal inferences. We then show how this decomposition can help scholars from different experimental and observational research traditions better understand each other’s inferential problems and attempted solutions. - Gary King, Langche Zeng. 2002. "Estimating Risk and Rate Levels, Ratios, and Differences in Case-Control Studies." Statistics in Medicine, 21, 10, Pp. 1409–1427.Article
+ Abstract
Classic (or “cumulative”) case-control sampling designs do not admit inferences about quantities of interest other than risk ratios, and then only by making the rare events assumption. Probabilities, risk differences, and other quantities cannot be computed without knowledge of the population incidence fraction. Similarly, density (or “risk set”) case-control sampling designs do not allow inferences about quantities other than the rate ratio. Rates, rate differences, cumulative rates, risks, and other quantities cannot be estimated unless auxiliary information about the underlying cohort such as the number of controls in each full risk set is available. Most scholars who have considered the issue recommend reporting more than just the relative risks and rates, but auxiliary population information needed to do this is not usually available. We address this problem by developing methods that allow valid inferences about all relevant quantities of interest from either type of case-control study when completely ignorant of or only partially knowledgeable about relevant auxiliary population information. - Gary King, Robert O. Keohane, Sidney Verba. 1994. "Designing Social Inquiry: Scientific Inference in Qualitative Research." Princeton University Press, Princeton, NJ.Publisher's Version
+ Abstract
Designing Social Inquiry presents a unified approach to qualitative and quantitative research in political science, showing how the same logic of inference underlies both. This stimulating book discusses issues related to framing research questions, measuring the accuracy of data and the uncertainty of empirical inferences, discovering causal effects, and getting the most out of qualitative research. It addresses topics such as interpretation and inference, comparative case studies, constructing causal theories, dependent and explanatory variables, the limits of random selection, selection bias, and errors in measurement. The book only uses mathematical notation to clarify concepts, and assumes no prior knowledge of mathematics or statistics.
See the 2021 edition.
- Gary King. 1991. "'Truth' Is Stranger Than Prediction, More Questionable Than Causal Inference." American Journal of Political Science, 35, Pp. 1047–1053.Article
+ Abstract
Robert Luskin’s article in this issue provides a useful service by appropriately qualifying several points I made in my 1986 American Journal of Political Science article. Whereas I focused on how to avoid common mistakes in quantitative political sciences, Luskin clarifies ways to extract some useful information from usually problematic statistics: correlation coefficients, standardized coefficients, and especially R2. Since these three statistics are very closely related (and indeed deterministic functions of one another in some cases), I focus in this discussion primarily on R2, the most widely used and abused. Luskin also widens the discussion to various kinds of specification tests, a general issue I also address. In fact, as Beck (1991) reports, a large number of formal specification tests are just functions of R2, with differences among them primarily due to how much each statistic penalizes one for including extra parameters and fewer observations. Quantitative political scientists often worry about model selection and specification, asking questions about parameter identification, autocorrelated or heteroscedastic disturbances, parameter constancy, variable choice, measurement error, endogeneity, functional forms, stochastic assumptions, and selection bias, among numerous others. These model specification questions are all important, but we may have forgotten why we pose them. Political scientists commonly give three reasons: (1) finding the “true” model, or the “full” explanation and (2) prediction and and (3) estimating specific causal effects. I argue here that (1) is used the most but useful the least and (2) is very useful but not usually in political science where forecasting is not often a central concern and and (3) correctly represents the goals of political scientists and should form the basis of most of our quantitative empirical work.
Software
- Gary King, Christopher Lucas, Richard Nielsen. 2014. "MatchingFrontier: R Package for Calculating the Balance-Sample Size Frontier."
+ Abstract
MatchingFrontier is an easy-to-use R Package for making optimal causal inferences from observational data. Despite their popularity, existing matching approaches leave researchers with two fundamental tensions. First, they are designed to maximize one metric (such as propensity score or Mahalanobis distance) but are judged against another for which they were not designed (such as L1 or differences in means). Second, they lack a principled solution to revealing the implicit bias-variance trade off: matching methods need to optimize with respect to both imbalance (between the treated and control groups) and the number of observations pruned, but existing approaches optimize with respect to only one; users then either ignore the other, or tweak it, usually suboptimally, by hand.
MatchingFrontier resolves both tensions by consolidating previous techniques into a single, optimal, and flexible approach. It calculates the matching solution with maximum balance for each possible sample size (N, N-1, N-2,…). It thus directly calculates the entire balance-sample size frontier, from which the user can easily choose one, several, or all subsamples from which to conduct their final analysis, given their own choice of imbalance metric and quantity of interest. MatchingFrontier solves the obvious joint optimization problem in one run, automatically, without manual tweaking, and without iteration. Although for each subset size k, there exist a huge (N choose k) number of unique subsets, MatchingFrontier includes specially designed fast algorithms that give the optimal answer, usually in a few minutes.
MatchingFrontier has officially been “Qualified for Scientific Use” by the U.S. Food and Drug Administration.
- Daniel E. Ho, Kosuke Imai, Gary King, Elizabeth A. Stuart. 2011. "MatchIt: Nonparametric Preprocessing for Parametric Causal Inference." Journal of Statistical Software, 42, 8, Pp. 1-28.Article Publisher's Version
+ Abstract
MatchIt implements the suggestions of Ho, Imai, King, and Stuart (2007) for improving parametric statistical models by preprocessing data with nonparametric matching methods. MatchIt implements a wide range of sophisticated matching methods, making it possible to greatly reduce the dependence of causal inferences on hard-to-justify, but commonly made, statistical modeling assumptions. The software also easily fits into existing research practices since, after preprocessing data with MatchIt, researchers can use whatever parametric model they would have used without MatchIt, but produce inferences with substantially more robustness and less sensitivity to modeling assumptions. MatchIt is an R program, and also works seamlessly with Zelig. - Matthew Blackwell, Stefano Iacus, Gary King, Giuseppe Porro. 2009. "CEM: Coarsened Exact Matching in Stata." The Stata Journal, 9(4), 524–546.Article Publisher's Version
+ Abstract
In this article, we introduce a Stata implementation of coarsened exact matching, a new method for improving the estimation of causal effects by reducing imbalance in covariates between treated and control groups. Coarsened exact matching is faster, is easier to use and understand, requires fewer assumptions, is more easily automated, and possesses more attractive statistical properties for many applications than do existing matching methods. In coarsened exact matching, users temporarily coarsen their data, exact match on these coarsened data, and then run their analysis on the uncoarsened, matched data. Coarsened exact matching bounds the degree of model dependence and causal effect estimation error by ex ante user choice, is monotonic imbalance bounding (so that reducing the maximum imbalance on one variable has no effect on others), does not require a separate procedure to restrict data to common support, meets the congruence principle, is approximately invariant to measurement error, balances all nonlinearities and interactions in sample (i.e., not merely in expectation), and works with multiply imputed datasets. Other matching methods inherit many of the coarsened exact matching method’s properties when applied to further match data preprocessed by coarsened exact matching. The cem command implements the coarsened exact matching algorithm in Stata. - Gary King, Kosuke Imai, Daniel Ho, Elizabeth A. Stuart. 2007. "MatchIt: Nonparametric Preprocessing for Parametric Causal Inference."
- Kosuke Imai, Gary King, Olivia Lau. 2006. "Zelig: Everyone's Statistical Software."
- Heather Stoll, Gary King, Langchee Zeng. 2005. "WhatIf: Software for Evaluating Counterfactuals." Journal of Statistical Software, 15, 4, Pp. 1-18.Article Publisher's Version
+ Abstract
This article describes WhatIf: Software for Evaluating Counterfactuals, an R package that implements the methods for evaluating counterfactuals introduced in King and Zeng (2006a) and King and Zeng (2006b). It offers easy-to-use techniques for assessing a counterfactual’s model dependence without having to conduct sensitivity testing over specified classes of models. These same methods can be used to approximate the common support of the treatment and control groups in causal inference. - Michael Tomz, Jason Wittenberg, Gary King. 2003. "CLARIFY: Software for Interpreting and Presenting Statistical Results." Journal of Statistical Software, 8(1).
+ Abstract
This is a set of easy-to-use tools that implement the techniques described in Gary King, Michael Tomz, and Jason Wittenberg’s “Making the Most of Statistical Analyses: Improving Interpretation and Presentation.” Winner of the Okidata Best Research Software Award from the American Political Science Association. These tools use Monte Carlo simulations to compute interpretable quantities from regression models and perform inference on them. For Stata, see the Journal of Statistical Software article (doi:10.18637/jss.v008.i01); for current R implementations, see https://iqss.github.io/clarify
Applications
- Bharat Anand, Gary King, Kiran Misra, Sascha Riaz. 2025. "Experimental Evidence on the (Limited) Influence of Reputable Media Outlets."Article Appendix
+ Abstract
High quality news outlets are widely regarded as essential to responsive, uncorrupt democratic governments. However, experimental validation of the mechanisms of this claim, whereby outlets influence citizen knowledge and views, has proven elusive because reputable outlets try to publish the truth (and so valid control groups are hard to find), do not randomize news content, and have business models that generate massive endogeneity for researchers. We worked with a major media outlet to overcome these problems and meet journalistic and scientific standards. The results of four experiments covering crime, the economy, the environment, and gender equity indicate that editorial decisions have large effects on readers’ factual knowledge, as implied by claims about the importance of the press, but they are only modestly larger than the effect of sponsored content on the same sites, which anyone can buy without editorial oversight. Moreover, at least in the short term, editorial decisions are no different from sponsored content purchases for other outcomes: Effects on political attitudes and policy preferences are statistically indistinguishable from each other, approximately zero, and the same across policy areas. Our results suggest that the traditional news media provides a clear but tenuous foundation for democratic citizen education. - Gary King, Benjamin Schneer, Ariel White. 2014. "Methods for Extremely Large Scale Media Experiments and Observational Studies (Poster)." In Society for Political Methodology. Athens, GA.Poster
+ Abstract
This is a poster presentation describing (1) the largest ever experimental study of media effects, with more than 50 cooperating traditional media sites, normally unavailable web site analytics, the text of hundreds of thousands of news articles, and tens of millions of social media posts, and (2) a design we used in preparation that attempts to anticipate experimental outcomes - Gary King, Richard Nielsen, Carter Coberley, James Pope, Aaron Wells. 2011. "Avoiding Randomization Failure in Program Evaluation." Population Health Management, 14, 1_suppl, Pp. S11-S22.Article
+ Abstract
We highlight common problems in the application of random treatment assignment in large scale program evaluation. Random assignment is the defining feature of modern experimental design. Yet, errors in design, implementation, and analysis often result in real world applications not benefiting from the advantages of randomization. The errors we highlight cover the control of variability, levels of randomization, size of treatment arms, and power to detect causal effects, as well as the many problems that commonly lead to post-treatment bias. We illustrate with an application to the Medicare Health Support evaluation, including recommendations for improving the design and analysis of this and other large scale randomized experiments. - Gretchen Stevens, Gary King, Kenji Shibuya. 2010. "Deaths From Heart Failure: Using Coarsened Exact Matching to Correct Cause of Death Statistics." Population Health Metrics, 8, 6.Article
+ Abstract
Background: Incomplete information on death certificates makes recorded cause of death data less useful for public health monitoring and planning. Certifying physicians sometimes list only the mode of death (and in particular, list heart failure) without indicating the underlying disease(s) that gave rise to the death. This can prevent valid epidemiologic comparisons across countries and over time. Methods and Results: We propose that coarsened exact matching be used to infer the underlying causes of death where only the mode of death is known; we focus on the case of heart failure in U.S., Mexican and Brazilian death records. Redistribution algorithms derived using this method assign the largest proportion of heart failure deaths to ischemic heart disease in all three countries (53%, 26% and 22%), with larger proportions assigned to hypertensive heart disease and diabetes in Mexico and Brazil (16% and 23% vs. 7% for hypertensive heart disease and 13% and 9% vs. 6% for diabetes). Reassigning these heart failure deaths increases US ischemic heart disease mortality rates by 6%.Conclusions: The frequency with which physicians list heart failure in the causal chain for various underlying causes of death allows for inference about how physicians use heart failure on the death certificate in different settings. This easy-to-use method has the potential to reduce bias and increase comparability in cause-of-death data, thereby improving the public health utility of death records. Key Words: vital statistics, heart failure, population health, mortality, epidemiology - Lee Epstein, Daniel E. Ho, Gary King, Jeffrey A. Segal. 2006. "The Effect of War on the Supreme Court." In Principles and Practice in American Politics: Classic and Contemporary Readings, edited by Samuel Kernell and Steven S. Smith, 3rd ed. Washington, D.C.: Congressional Quarterly Press.Book Chapter
+ Abstract
Does the U.S. Supreme Court curtail rights and liberties when the nation’s security is under threat? In hundreds of articles and books, and with renewed fervor since September 11, 2001, members of the legal community have warred over this question. Yet, not a single large-scale, quantitative study exists on the subject. Using the best data available on the causes and outcomes of every civil rights and liberties case decided by the Supreme Court over the past six decades and employing methods chosen and tuned especially for this problem, our analyses demonstrate that when crises threaten the nation’s security, the justices are substantially more likely to curtail rights and liberties than when peace prevails. Yet paradoxically, and in contradiction to virtually every theory of crisis jurisprudence, war appears to affect only cases that are unrelated to the war. For these cases, the effect of war and other international crises is so substantial, persistent, and consistent that it may surprise even those commentators who long have argued that the Court rallies around the flag in times of crisis. On the other hand, we find no evidence that cases most directly related to the war are affected. We attempt to explain this seemingly paradoxical evidence with one unifying conjecture: Instead of balancing rights and security in high stakes cases directly related to the war, the Justices retreat to ensuring the institutional checks of the democratic branches. Since rights-oriented and process-oriented dimensions seem to operate in different domains and at different times, and often suggest different outcomes, the predictive factors that work for cases unrelated to the war fail for cases related to the war. If this conjecture is correct, federal judges should consider giving less weight to legal principles outside of wartime but established during wartime, and attorneys should see it as their responsibility to distinguish cases along these lines. - Lee Epstein, Daniel E. Ho, Gary King, Jeffrey A. Segal. 2005. "The Supreme Court During Crisis: How War Affects only Non-War Cases." New York University Law Review, 80, Pp. 1–116.Article
+ Abstract
Does the U.S. Supreme Court curtail rights and liberties when the nation’s security is under threat? In hundreds of articles and books, and with renewed fervor since September 11, 2001, members of the legal community have warred over this question. Yet, not a single large-scale, quantitative study exists on the subject. Using the best data available on the causes and outcomes of every civil rights and liberties case decided by the Supreme Court over the past six decades and employing methods chosen and tuned especially for this problem, our analyses demonstrate that when crises threaten the nation’s security, the justices are substantially more likely to curtail rights and liberties than when peace prevails. Yet paradoxically, and in contradiction to virtually every theory of crisis jurisprudence, war appears to affect only cases that are unrelated to the war. For these cases, the effect of war and other international crises is so substantial, persistent, and consistent that it may surprise even those commentators who long have argued that the Court rallies around the flag in times of crisis. On the other hand, we find no evidence that cases most directly related to the war are affected. We attempt to explain this seemingly paradoxical evidence with one unifying conjecture: Instead of balancing rights and security in high stakes cases directly related to the war, the Justices retreat to ensuring the institutional checks of the democratic branches. Since rights-oriented and process-oriented dimensions seem to operate in different domains and at different times, and often suggest different outcomes, the predictive factors that work for cases unrelated to the war fail for cases related to the war. If this conjecture is correct, federal judges should consider giving less weight to legal principles outside of wartime but established during wartime, and attorneys should see it as their responsibility to distinguish cases along these lines. Winner of the McGraw-Hill Awardfor the best journal article on law and courts written by a political scientist and published during the previous calendar year; Law and Society Association Prize, Runner up, to “recognize exceptional scholarship in the field of sociolegal studies for an article published in the previous two years”;Pi Sigma Alpha Award, for the best paper delivered at the previous year’s MWPSA Conference; the Robert H. Durr Award, for “the best paper applying quantitative methods to a substantive problem” at the previous year’s MWPSA Conference; and the American Judicature Society Award, Honorable Mention, for the best paper presented at the previous year’s meetings of the American, Midwest, Northeastern, Southern, Southwest, or Western Political Science Associations.
Replication data at the Harvard Dataverse: https://doi.org/10.7910/DVN/OLD7MB.
Event Counts and Durations 🔗
Statistical models to explain or predict how many events occur for each fixed time period, or the time between events. An application to cabinet dissolution in parliamentary democracies which united two previously warring scholarly literature. Other applications to international relations and U.S. Supreme Court appointments.
Event Counts
- Federico Girosi, Gary King. 2008. "Demographic Forecasting." Princeton University Press, Princeton.Publisher's Site Errata Dataverse YourCast Software
+ Abstract
We introduce a new framework for forecasting age-sex-country-cause-specific mortality rates that incorporates considerably more information, and thus has the potential to forecast much better, than any existing approach. Mortality forecasts are used in a wide variety of academic fields, and for global and national health policy making, medical and pharmaceutical research, and social security and retirement planning. As it turns out, the tools we developed in pursuit of this goal also have broader statistical implications, in addition to their use for forecasting mortality or other variables with similar statistical properties. First, our methods make it possible to include different explanatory variables in a time series regression for each cross-section, while still borrowing strength from one regression to improve the estimation of all. Second, we show that many existing Bayesian (hierarchical and spatial) models with explanatory variables use prior densities that incorrectly formalize prior knowledge. Many demographers and public health researchers have fortuitously avoided this problem so prevalent in other fields by using prior knowledge only as an ex post check on empirical results, but this approach excludes considerable information from their models. We show how to incorporate this demographic knowledge into a model in a statistically appropriate way. Finally, we develop a set of tools useful for developing models with Bayesian priors in the presence of partial prior ignorance. This approach also provides many of the attractive features claimed by the empirical Bayes approach, but fully within the standard Bayesian theory of inference. - Gary King. 1998. "Unifying Political Methodology: The Likelihood Theory of Statistical Inference." University of Michigan Press, Ann Arbor.Publisher's Site Errata
+ Abstract
“One of the hallmarks of the development of political science as a discipline has been the creation of new methodologies by scholars within the discipline–methodologies that are well-suited to the analysis of political data. Gary King has been a leader in the development of these new approaches to the analysis of political data. In his book, Unifying Political Methodology, King shows how the likelihood theory of inference offers a unified approach to statistical modeling for political research and thus enables us to better analyze the enormous amount of data political scientists have collected over the years. Newly reissued, this book is a landmark in the development of political methodology and continues to challenge scholars and spark controversy.” - Gary King, Curtis Signorino. 1996. "The Generalization in the Generalized Event Count Model, With Comments on Achen, Amato, and Londregan." Political Analysis, 6, Pp. 225–252.Article
+ Abstract
We use an analogy with the normal distribution and linear regression to demonstrate the need for the Generalize Event Count (GEC) model. We then show how the GEC provides a unified framework within which to understand a diversity of distributions used to model event counts, and how to express the model in one simple equation. Finally, we address the points made by Christopher Achen, Timothy Amato, and John Londregan. Amato’s and Londregan’s arguments are consistent with ours and provide additional interesting information and explanations. Unfortunately, the foundation on which Achen built his paper turns out to be incorrect, rendering all his novel claims about the GEC false (or in some cases irrelevant). - Rainer Winkelmann, Curtis Signorino, Gary King. 1995. "A Correction for an Underdispersed Event Count Probability Distribution." Political Analysis, Pp. 215–228.Article
+ Abstract
We demonstrate that the expected value and variance commonly given for a well-known probability distribution are incorrect. We also provide corrected versions and report changes in a computer program to account for the known practical uses of this distribution. - Gary King. 1989. "A Seemingly Unrelated Poisson Regression Model." Sociological Methods and Research, 17, Pp. 235–255.Article
+ Abstract
This article introduces a new estimator for the analysis of two contemporaneously correlated endogenous event count variables. This seemingly unrelated Poisson regression model (SUPREME) estimator combines the efficiencies created by single equation Poisson regression model estimators and insights from “seemingly unrelated” linear regression models. - Gary King. 1989. "Event Count Models for International Relations: Generalizations and Applications." International Studies Quarterly, 33, Pp. 123–147.Article
+ Abstract
International relations theorists tend to think in terms of continuous processes. Yet we observe only discrete events, such as wars or alliances, and summarize them in terms of the frequency of occurrence. As such, most empirical analyses in international relations are based on event count variables. Unfortunately, analysts have generally relied on statistical techniques that were designed for continuous data. This mismatch between theory and method has caused bias, inefficiency, and numerous inconsistencies in both theoretical arguments and empirical findings throughout the literature. This article develops a much more powerful approach to modeling and statistical analysis based explicity on estimating continuous processes from observed event counts. To demonstrate this class of models, I present several new statistical techniques developed for and applied to different areas of international relations. These include the influence of international alliances on the outbreak of war, the contagious process of multilateral economic sanctions, and reciprocity in superpower conflict. I also show how one can extract considerably more information from existing data and relate substantive theory to empirical analyses more explicitly with this approach. - Gary King. 1989. "Variance Specification in Event Count Models: From Restrictive Assumptions to a Generalized Estimator." American Journal of Political Science, 33, Pp. 762–784.Article
+ Abstract
This paper discusses the problem of variance specification in models for event count data. Event counts are dependent variables that can take on only nonnegative integer values, such as the number of wars or coups d’etat in a year. I discuss several generalizations of the Poisson regression model, presented in King (1988), to allow for substantively interesting stochastic processes that do not fit into the Poisson framework. Individual models that cope with, and help analyze, heterogeneity, contagion, and negative contagion are each shown to lead to specific statistical models for event count data. In addition, I derive a new generalized event count (GEC) model that enables researchers to extract significant amounts of new information from existing data by estimating features of these unobserved substantive processes. Applications of this model to congressional challenges of presidential vetoes and superpower conflict demonstrate the dramatic advantages of this approach. - Gary King. 1988. "Statistical Models for Political Science Event Counts: Bias in Conventional Procedures and Evidence for The Exponential Poisson Regression Model." American Journal of Political Science, 32, Pp. 838-63.Article
+ Abstract
This paper presents analytical, Monte Carlo, and empirical evidence on models for event count data. Event counts are dependent variables that measure the number of times some event occurs. Counts of international events are probably the most common, but numerous examples exist in every empirical field of the discipline. The results of the analysis below strongly suggest that the way event counts have been analyzed in hundreds of important political science studies have produced statistically and substantively unreliable results. Misspecification, inefficiency, bias, inconsistency, insufficiency, and other problems result from the unknowing application of two common methods that are without theoretical justification or empirical unity in this type of data. I show that the exponential Poisson regression (EPR) model provides analytically, in large samples, and empirically, in small, finite samples, a far superior model and optimal estimator. I also demonstrate the advantage of this methodology in an application to nineteenth-century party switching in the U.S. Congress. Its use by political scientists is strongly encouraged. - Gary King. 1987. "Presidential Appointments to the Supreme Court: Adding Systematic Explanation to Probabilistic Description." American Politics Quarterly, 15, Pp. 373–386.Article
+ Abstract
Three articles, published in the leading journals of three disciplines over the last five decades, have each used the Poisson probability distribution to help describe the frequency with which presidents were able to appoint United States Supreme Court Justices. This work challenges these previous findings with a new model of Court appointments. The analysis demonstrates that the number of appointments a president can expect to make in a given year is a function of existing measurable variables.
Duration of Parliamentary Governments
- James E. Alt, Gary King, Curtis Signorino. 2001. "Aggregation Among Binary, Count, and Duration Models: Estimating the Same Quantities from Different Levels of Data." Political Analysis, 9, Pp. 21–44.Article
+ Abstract
Binary, count and duration data all code discrete events occurring at points in time. Although a single data generation process can produce all of these three data types, the statistical literature is not very helpful in providing methods to estimate parameters of the same process from each. In fact, only single theoretical process exists for which know statistical methods can estimate the same parameters - and it is generally used only for count and duration data. The result is that seemingly trivial decisions abut which level of data to use can have important consequences for substantive interpretations. We describe the theoretical event process for which results exist, based on time independence. We also derive a set of models for a time-dependent process and compare their predictions to those of a commonly used model. Any hope of understanding and avoiding the more serious problems of aggregation bias in events data is contingent on first deriving a much wider arsenal of statistical models and theoretical processes that are not constrained by the particular forms of data that happen to be available. We discuss these issues and suggest an agenda for political methodologists interested in this very large class of aggregation problems.
Replication data at the Harvard Dataverse: https://doi.org/10.7910/DVN/UDRSQ6.
- James Alt, Gary King. 1994. "Transfers of Governmental Power: The Meaning of Time Dependence." Comparative Political Studies, 27, Pp. 190–210.Article
+ Abstract
King, Alt, Burns, and Laver (1990) proposed and estimated a unified model in which cabinet durations depended on seven explanatory variables reflecting features of the cabinets and the bargaining environments in which they formed, along with a stochastic component in which the risk of a cabinet falling was treated as a constant across its tenure. Two recent research reports take issue with one aspect of this model. Warwick and Easton replicate the earlier findings for explanatory variables but claim that the stochastic risk should be seen as rising, and at a rate which varies, across the life of the cabinet. Bienen and van de Walle, using data on the duration of leaders, allege that random risk is falling. We continue in our goal of unifying this literature by providing further estimates with both cabinet and leader duration data that confirm the original explanatory variables’ effects, showing that leaders’ durations are affected by many of the same factors that affect the durability of the cabinets they lead, demonstrating that cabinets have stochastic risk of ending that is indeed constant across the theoretically most interesting range of durations, and suggesting that stochastic risk for leaders in countries with cabinet government is, if not constant, more likely to rise than fall. - Gary King, James Alt, Nancy Burns, Michael Laver. 1990. "A Unified Model of Cabinet Dissolution in Parliamentary Democracies." American Journal of Political Science, 34, Pp. 846–871.Article
+ Abstract
The literature on cabinet duration is split between two apparently irreconcilable positions. The attributes theorists seek to explain cabinet duration as a fixed function of measured explanatory variables, while the events process theorists model cabinet durations as a product of purely stochastic processes. In this paper we build a unified statistical model that combines the insights of these previously distinct approaches. We also generalize this unified model, and all previous models, by including (1) a stochastic component that takes into account the censoring that occurs as a result of governments lasting to the vicinity of the maximum constitutional interelection period, (2) a systematic component that precludes the possibility of negative duration predictions, and (3) a much more objective and parsimonious list of explanatory variables, the explanatory power of which would not be improved by including a list of indicator variables for individual countries.
Replication data at the Harvard Dataverse: https://doi.org/10.7910/DVN/CVJPAN.
Software
- Kosuke Imai, Gary King, Olivia Lau. 2006. "Zelig: Everyone's Statistical Software."
- Gary King. 2002. "COUNT: A Program for Estimating Event Count and Duration Regressions."
+ Abstract
This software is no longer being actively updated. Previous versions and information about the software are archived here.
A stand-alone, easy-to-use program for running event count and duration regression models, developed by and/or discussed in a series of journal articles by Gary King. (Event count models have a dependent variable measured as the number of times something happens, such as the number of uncontested seats per state or the number of wars per year. Duration models explain dependent variables measured as the time until some event, such as the number of months a parliamentary cabinet endures.) Winner of the APSA Research Software Award.
Related Data
- Gary King. 2003. "10 Million International Dyadic Events."
Ecological Inference 🔗
Inferring individual behavior from group-level data: The first approach to incorporate both unit-level deterministic bounds and cross-unit statistical information, methods for 2x2 and larger tables, Bayesian model averaging, applications to elections, software.
Methods
- Wenxin Jiang, Gary King, Allen Schmaltz, Martin A. Tanner. 2019. "Ecological Regression With Partial Identification." Political Analysis, 28, 1, Pp. 65–86.Article Appendix
+ Abstract
Ecological inference (EI) is the process of learning about individual behavior from aggregate data. We relax assumptions by allowing for “linear contextual effects,” which previous works have regarded as plausible but avoided due to non-identification, a problem we sidestep by deriving bounds instead of point estimates. In this way, we offer a conceptual framework to improve on the Duncan-Davis bound, derived more than sixty-five years ago. To study the effectiveness of our approach, we collect and analyze 8,430 2x2 EI datasets with known ground truth from several sources — thus bringing considerably more data to bear on the problem than the existing dozen or so datasets available in the literature for evaluating EI estimators. For the 88% of real data sets in our collection that fit a proposed rule, our approach reduces the width of the Duncan-Davis bound, on average, by about 44%, while still capturing the true district level parameter about 99% of the time. The remaining 12% revert to the Duncan-Davis bound.
Easy-to-use software is available that implements all the methods described in the paper.
Replication data at the Harvard Dataverse: https://doi.org/10.7910/DVN/8TB7GO.
- Gary King, Ori Rosen, Martin Tanner, Alexander Wagner. 2008. "Ordinary Economic Voting Behavior in the Extraordinary Election of Adolf Hitler." Journal of Economic History, 68, 4, Pp. 996.Article
+ Abstract
The enormous Nazi voting literature rarely builds on modern statistical or economic research. By adding these approaches, we find that the most widely accepted existing theories of this era cannot distinguish the Weimar elections from almost any others in any country. Via a retrospective voting account, we show that voters most hurt by the depression, and most likely to oppose the government, fall into separate groups with divergent interests. This explains why some turned to the Nazis and others turned away. The consequences of Hitler’s election were extraordinary, but the voting behavior that led to it was not.
Replication data at the Harvard Dataverse: https://doi.org/10.7910/DVN/OMYW0P.
- Gary King, Ori Rosen, Martin Tanner. 2006. "Ecological Inference." In The New Palgrave Dictionary of Economics, edited by Larry Blume and Steven N. Durlauf, 2nd ed. London: Palgrave.Book Chapter
+ Abstract
Dictionary entry on the definition of “ecological inference,” and a brief summary of the history of ecological inference research. - Kosuke Imai, Gary King. 2004. "Did Illegal Overseas Absentee Ballots Decide the 2000 U.S. Presidential Election?." Perspectives on Politics, 2, Pp. 537–549.Article
+ Abstract
Although not widely known until much later, Al Gore received 202 more votes than George W. Bush on election day in Florida. George W. Bush is president because he overcame his election day deficit with overseas absentee ballots that arrived and were counted after election day. In the final official tally, Bush received 537 more votes than Gore. These numbers are taken from the official results released by the Florida Secretary of State’s office and so do not reflect overvotes, undervotes, unsuccessful litigation, butterfly ballot problems, recounts that might have been allowed but were not, or any other hypothetical divergence between voter preferences and counted votes. After the election, the New York Timesconducted a six month long investigation and found that 680 of the overseas absentee ballots were illegally counted, and no partisan, pundit, or academic has publicly disagreed with their assessment. In this paper, we describe the statistical procedures we developed and implemented for the Timesto ascertain whether disqualifying these 680 ballots would have changed the outcome of the election. The methods involve adding formal Bayesian model averaging procedures to King’s (1997) ecological inference model. Formal Bayesian model averaging has not been used in political science but is especially useful when substantive conclusions depend heavily on apparently minor but indefensible model choices, when model generalization is not feasible, and when potential critics are more partisan than academic. We show how we derived the results for the Timesso that other scholars can use these methods to make ecological inferences for other purposes. We also present a variety of new empirical results that delineate the precise conditions under which Al Gore would have been elected president, and offer new evidence of the striking effectiveness of the Republican effort to convince local election officials to count invalid ballots in Bush counties and not count them in Gore counties. - Gary King, Ori Rosen, Martin Tanner. 2004. "Ecological Inference: New Methodological Strategies." Cambridge University Press, New York.Book Publisher's Site
+ Abstract
Ecological Inference: New Methodological Strategies brings together a diverse group of scholars to survey the latest strategies for solving ecological inference problems in various fields. The last half decade has witnessed an explosion of research in ecological inference – the attempt to infer individual behavior from aggregate data. The uncertainties and the information lost in aggregation make ecological inference one of the most difficult areas of statistical inference, but such inferences are required in many academic fields, as well as by legislatures and the courts in redistricting, by businesses in marketing research, and by governments in policy analysis. - Gary King, Ori Rosen, Martin Tanner. 2004. "Information in Ecological Inference: An Introduction." In Ecological Inference: New Methodological Strategies. New York: Cambridge University Press.
- James E. Alt, Gary King, Curtis Signorino. 2001. "Aggregation Among Binary, Count, and Duration Models: Estimating the Same Quantities from Different Levels of Data." Political Analysis, 9, Pp. 21–44.Article
+ Abstract
Binary, count and duration data all code discrete events occurring at points in time. Although a single data generation process can produce all of these three data types, the statistical literature is not very helpful in providing methods to estimate parameters of the same process from each. In fact, only single theoretical process exists for which know statistical methods can estimate the same parameters - and it is generally used only for count and duration data. The result is that seemingly trivial decisions abut which level of data to use can have important consequences for substantive interpretations. We describe the theoretical event process for which results exist, based on time independence. We also derive a set of models for a time-dependent process and compare their predictions to those of a commonly used model. Any hope of understanding and avoiding the more serious problems of aggregation bias in events data is contingent on first deriving a much wider arsenal of statistical models and theoretical processes that are not constrained by the particular forms of data that happen to be available. We discuss these issues and suggest an agenda for political methodologists interested in this very large class of aggregation problems.
Replication data at the Harvard Dataverse: https://doi.org/10.7910/DVN/UDRSQ6.
- Ori Rosen, Wenxin Jiang, Gary King, Martin Tanner. 2001. "Bayesian and Frequentist Inference for Ecological Inference: The RxC Case." Statistica Neerlandica, 55, Pp. 134–156.Article
+ Abstract
In this paper we propose Bayesian and frequentist approaches to ecological inference, based on R x C contingency tables, including a covariate. The proposed Bayesian model extends the binomial-beta hierarchical model developed by King, Rosen and Tanner (1999) from the 2 x 2 case to the R x C case, the inferential procedure employs Markov chain Monte Carlo (MCMC) methods. As such the resulting MCMC analysis is rich but computationally intensive. The frequentist approach, based on first moments rather than on the entire likelihood, provides quick inference via nonlinear least-squares, while retaining good frequentist properties. The two approaches are illustrated with simulated data, as well as with real data on voting patterns in Weimar Germany. In the final section of the paper we provide an overview of a range of alternative inferential approaches which trade-off computational intensity for statistical efficiency. - Gary King, Ori Rosen, Martin Tanner. 1999. "Binomial-Beta Hierarchical Models for Ecological Inference." Sociological Methods and Research, 28, Pp. 61–90.Article
+ Abstract
The authors develop binomial-beta hierarchical models for ecological inference using insights from the literature on hierarchical models based on Markov chain Monte Carlo algorithms and King’s ecological inference model. The new approach reveals some features of the data that King’s approach does not, can easily be generalized to more complicated problems such as general R x C tables, allows the data analyst to adjust for covariates, and provides a formal evaluation of the significance of the covariates. It may also be better suited to cases in which the observed aggregate cells are estimated from very few observations or have some forms of measurement error. This article also provides an example of a hierarchical model in which the statistical idea of “borrowing strength” is used not merely to increase the efficiency of the estimates but to enable the data analyst to obtain estimates. - Gary King. 1997. "A Solution to the Ecological Inference Problem: Reconstructing Individual Behavior from Aggregate Data." Princeton University Press, Princeton, NJ.Book Publisher's Site
+ Abstract
“This book provides a solution to the ecological inference problem, which has plagued users of statistical methods for over seventy-five years: How can researchers reliably infer individual-level behavior from aggregate (ecological) data? In political science, this question arises when individual-level surveys are unavailable (for instance, local or comparative electoral politics), unreliable (racial politics), insufficient (political geography), or infeasible (political history). This ecological inference problem also confronts researchers in numerous areas of major significance in public policy, and other academic disciplines, ranging from epidemiology and marketing to sociology and quantitative history. Although many have attempted to make such cross-level inferences, scholars agree that all existing methods yield very inaccurate conclusions about the world. In this volume, Gary King lays out a unique—and reliable—solution to this venerable problem.
King begins with a qualitative overview, readable even by those without a statistical background. He then unifies the apparently diverse findings in the methodological literature, so that only one aggregation problem remains to be solved. He then presents his solution, as well as empirical evaluations of the solution that include over 16,000 comparisons of his estimates from real aggregate data to the known individual-level answer. The method works in practice.
King’s solution to the ecological inference problem will enable empirical researchers to investigate substantive questions that have heretofore proved unanswerable, and move forward fields of inquiry in which progress has been stifled by this problem.”
Software
- Kosuke Imai, Gary King, Olivia Lau. 2006. "Zelig: Everyone's Statistical Software."
- Gary King. 2004. "EI: A Program for Ecological Inference." Journal of Statistical Software, 11, 7.Article Publisher's Version EI program (Gauss) DOI
+ Abstract
The program EI provides a method of inferring individual behavior from aggregate data. It implements the statistical procedures, diagnostics, and graphics from the book A Solution to the Ecological Inference Problem: Reconstructing Individual Behavior from Aggregate Data (King 1997).
Ecological inference, as traditionally defined, is the process of using aggregate (i.e., “ecological”) data to infer discrete individual-level relationships of interest when individual-level data are not available. Ecological inferences are required in political science research when individual-level surveys are unavailable (e.g., local or comparative electoral politics), unreliable (racial politics), insufficient (political geography), or infeasible (political history). They are also required in numerous areas of major significance in public policy (e.g., for applying the Voting Rights Act) and other academic disciplines ranging from epidemiology and marketing to sociology and quantitative history.
- Gary King. 2003. "EI: A Program for Ecological Inference."
- Gary King, Kenneth Benoit. 2003. "EzI: A(n Easy) Program for Ecological Inference." Journal of Statistical Software, 11.
+ Abstract
This software is no longer being actively updated. Previous versions and information about the software are archived here. - Kenneth Benoit, Gary King. 1996. "A Preview of EI and EzI: Programs for Ecological Inference." Social Science Computer Review, 14, Pp. 433–438.
+ Abstract
Ecological inference, as traditionally defined, is the process of using aggregate (i.e., “ecological”) data to infer discrete individual-level relationships of interest when individual-level data are not available. Existing methods of ecological inference generate very inaccurate conclusions about the empirical world- which thus gives rise to the ecological inference problem. Most scholars who analyze aggregate data routinely encounter some form of this problem. EI (by Gary King) and EzI (by Kenneth Benoit and Gary King) are freely available software that implement the statistical and graphical methods detailed in Gary King’s book A Solution to the Ecological Inference Problem. These methods make it possible to infer the attributes of individual behavior from aggregate data. EI works within the statistics program Gauss and will run on any computer hardware and operating system that runs Gauss (the Gauss module, CML, or constrained maximum likelihood- by Ronald J. Schoenberg- is also required). EzI is a menu-oriented stand-alone version of the program that runs under MS-DOS (and soon Windows 95, OS/2, and HP-UNIX). EI allows users to make ecological inferences as part of the powerful and open Gauss statistical environment. In contrast, EzI requires no additional software, and provides an attractive menu-based user interface for non-Gauss users, although it lacks the flexibility afforded by the Gauss version. Both programs presume that the user has read or is familiar with A Solution to the Ecological Inference Problem.
Discussions and Extensions
- Gary King. 2004. "Finding New Information for Ecological Inference Models: A Comment on Jon Wakefield, 'Ecological Inference in 2X2 Tables'." Journal of the Royal Statistical Society, Series A, 167(3), p. 437.
- Christopher Adolph, Gary King, Kenneth Shotts, Michael Herron. 2003. "A Consensus on Second Stage Analyses in Ecological Inference Models." Political Analysis, 11, Pp. 86–94.Article
+ Abstract
Since Herron and Shotts (2003a and hereinafter HS), Adolph and King (2003 andhereinafter AK), and Herron and Shotts (2003b and hereinafter HS2), the four of us have iterated many more times, learned a great deal, and arrived at a consensus on this issue. This paper describes our joint recommendations for how to run second-stage ecological regressions, and provides detailed analyses to back up our claims. - Christopher Adolph, Gary King. 2003. "Analyzing Second Stage Ecological Regressions."
- Gary King. 2002. "Isolating Spatial Autocorrelation, Aggregation Bias, and Distributional Violations in Ecological Inference." Political Analysis, 10, Pp. 298–300.Article
+ Abstract
This is an invited response to an article by Anselin and Cho. I make two main points: The numerical results in this article violate no conclusions from prior literature, and the absence of the deterministic information from the bounds in the article’s analyses invalidates its theoretical discussion of spatial autocorrelation and all of its actual simulation results. An appendix shows how to draw simulations correctly. - Gary King. 2000. "Geography, Statistics, and Ecological Inference." Annals of the Association of American Geographers, 90, Pp. 601–606.Article
+ Abstract
I am grateful for such thoughtful review from these three distinguished geographers. Fotheringham provides an excellent summary of the approach offered, including how it combines the two methods that have dominated applications (and methodological analysis) for nearly half a century– the method of bounds (Duncan and Davis, 1953) and Goodman’s (1953) least squares regression. Since Goodman’s regression is the only method of ecological inference “widely used in Geography” (O’Loughlin), adding information that is known to be true from the method of bounds (for each observation) would seem to have the chance to improve a lot of research in this field. The other addition that EI provides is estimates at the lowest level of geography available, making it possible to map results, instead of giving only single summary numbers for the entire geographic region. Whether one considers the combined method offered “the” solution (as some reviewers and commentators have portrayed it), “a” solution (as I tried to describe it), or, perhaps better and more simply, as an improved method of ecological inference, is not importatnt. The point is that more data are better, and this method incorporates more. I am gratified that all three reviewers seem to support these basic points. In this response, I clarify a few points, correct some misunderstandings, and present additional evidence. I conclude with some possible directions for future research. - Gary King. 1999. "The Future of Ecological Inference Research: A Reply to Freedman et Al.." Journal of the American Statistical Association, 94, Pp. 352-55.Article
+ Abstract
I appreciate the editor’s invitation to reply to Freedman et al.’s (1998) review of “A Solution to the Ecological Inference Problem: Reconstructing Individual Behavior from Aggregate Data” (Princeton University Press.) I welcome this scholarly critique and JASA’s decision to publish in this field. Ecological inference is a large and very important area for applications that is especially rich with open statistical questions. I hope this discussion stimulates much new scholarship. Freedman et al. raise several interesting issues, but also misrepresent or misunderstand the prior literature, my approach, and their own empirical analyses, and compound the problem, by refusing requests from me and the editor to make their data and software available for this note. Some clarification is thus in order.
Missing Data, Measurement Error, Differential Privacy 🔗
Statistical methods to accommodate missing information in data sets due to survey nonresponse, missing variables, or variables measured with error or with error added to protect privacy. Applications and software for analyzing electoral, compositional, survey, time series, and time series cross-sectional data.
Differential Privacy
- Georgina Evans, Gary King. 2025. "Statistically Valid Inferences from Differentially Private Data Releases, II: Extensions to Nonlinear Transformations."Article
+ Abstract
We extend Evans and King (Forthcoming, 2021) to nonlinear transformations, using proportions and weighted averages as our running examples. - María Ballesteros, Cynthia Dwork, Gary King, Conlan Olson, Manish Raghavan. 2025. "Evaluating the Impacts of Swapping on the US Decennial Census." Proceedings of the Symposium on Computer Science and Law on ZZZ, Pp. 64–76.Article
+ Abstract
To meet its dual burdens of providing useful statistics and ensuring privacy of individual respondents, the US Census Bureau has for decades introduced some form of “noise” into published statistics. Initially, they used a method known as “swapping” (1990–2010). In 2020, they switched to an algorithm called TopDown that ensures a form of Differential Privacy. While the TopDown algorithm has been made public, no implementation of swapping has been released and many details of the deployed swapping methodology deployed have been kept secret. Further, the Bureau has not published (even a synthetic) “original” dataset and its swapped version. It is therefore difficult to evaluate the effects of swapping, and to compare these effects to those of other privacy technologies. To address these difficulties we describe and implement a parameterized swapping algorithm based on Census publications, court documents, and informal interviews with Census employees. With this implementation, we characterize the impacts of swapping on a range of statistical quantities of interest. We provide intuition for the types of shifts induced by swapping and compare against those introduced by TopDown. We find that even when swapping and TopDown introduce errors of similar magnitude, the direction in which statistics are biased need not be the same across the two techniques. More broadly, our implementation provides researchers with the tools to analyze and potentially correct for the impacts of disclosure avoidance systems on the quantities they study. - Georgina Evans, Gary King, Adam D. Smith, Abhradeep Thakurta. 2024. "Differentially Private Survey Research." American Journal of Political Science, 70, 1, Pp. 90–103.Article Publisher's Version Appendix
+ Abstract
Survey researchers have long sought to protect the privacy of their respondents via de-identification (removing names and other directly identifying information) before sharing data. Although these procedures can help, recent research demonstrates that they fail to protect respondents from intentional re-identification attacks, a problem that threatens to undermine vast survey enterprises in academia, government, and industry. This is especially a problem in political science because political beliefs are not merely the subject of our scholarship; they represent some of the most important information respondents want to keep private. We confirm the problem in practice by re-identifying individuals from a survey about a controversial referendum declaring life beginning at conception. We build on the concept of “differential privacy” to offer new data sharing procedures with mathematical guarantees for protecting respondent privacy and statistical validity guarantees for social scientists analyzing differentially private data. The cost of these new procedures is larger standard errors, which can be overcome with somewhat larger sample sizes.
Replication data at the Harvard Dataverse: https://doi.org/10.7910/DVN/X4Y2FL.
- Georgina Evans, Gary King. 2023. "Statistically Valid Inferences from Differentially Private Data Releases, With Application to the Facebook URLs Dataset." Political Analysis, 31, 1, Pp. 1–21.Article Publisher's Version
+ Abstract
We offer methods to analyze the “differentially private” Facebook URLs Dataset which, at over 40 trillion cell values, is one of the largest social science research datasets ever constructed. The version of differential privacy used in the URLs dataset has specially calibrated random noise added, which provides mathematical guarantees for the privacy of individual research subjects while still making it possible to learn about aggregate patterns of interest to social scientists. Unfortunately, random noise creates measurement error which induces statistical bias – including attenuation, exaggeration, switched signs, or incorrect uncertainty estimates. We adapt methods developed to correct for naturally occurring measurement error, with special attention to computational efficiency for large datasets. The result is statistically valid linear regression estimates and descriptive statistics that can be interpreted as ordinary analyses of non-confidential data but with appropriately larger standard errors.
We have implemented these methods in open source software for R called PrivacyUnbiased. Facebook has ported PrivacyUnbiased to open source Python code called svinfer. We have extended these results in Evans and King (2021).
Replication data at the Harvard Dataverse: https://doi.org/10.7910/DVN/UDFZJD.
- Georgina Evans, Gary King, Margaret Schwenzfeier, Abhradeep Thakurta. 2023. "Statistically Valid Inferences from Privacy Protected Data." American Political Science Review, 117, 4, Pp. 1275–1290.Article Publisher's Version Appendix
+ Abstract
Venerable procedures used for privacy protection in sharing data within individual companies and governments, within academia, and between sectors have recently been proven massively inadequate (e.g., respondents in de-identified surveys can usually be re-identified). Furthermore, the benefits of getting our data sharing act together go far beyond the university, since unprecedented quantities of data that could help social scientists understand and ameliorate the challenges of human society are presently locked away inside companies, governments, and other organizations, in part because of worries about privacy violations. We address these problems with a general-purpose data access and analysis system with mathematical guarantees of privacy for individuals who may be represented in the data, statistical guarantees for researchers seeking insights from it, and protection for society from some fallacious scientific conclusions. We build on the standard of “differential privacy’’ but, unlike most such approaches, we also correct for the serious statistical biases induced by privacy-preserving procedures, provide a proper accounting for statistical uncertainty, and impose minimal constraints on the choice of data analytic methods and types of quantities estimated. Our algorithm is easy to implement, simple to use, and computationally efficient; we also offer open source software to illustrate all our methods.
Based on papers (each joint with subsets of Georgie Evans, Meg Schwenzfeier, Adam Smith, and Abhradeep Thakurta) available at GaryKing.org/privacy.
- Cynthia Dwork, Ruth Greenwood, Gary King. 2021. "Letter to US Census Bureau: 'Request for Release of 'noisy Measurements File' by September 30 Along With Redistricting Data Products'."Letter
+ Abstract
A letter, submitted on behalf of a large group of expert signatories, to request the release of the “noisy measurements file” and other redistricting data by September 30, 2021. This includes the data created by the Bureau in preparing its differentially private data release, without their unnecessary (and, in many important situations, information destroying) post-processing. - Cynthia Dwork, Ruth Greenwood, Gary King. 2021. "There's a Simple Solution to the Latest Census Fight." Boston Globe, Pp. A9.Article Publisher's Version
+ Abstract
We offer a solution to debates over the use of differential privacy in releasing US Census Data.
Missing Data, Measurement Error
- Katherine Clayton, Yusaku Horiuchi, Aaron Kaufman, Gary King, Mayya Komisarchik. 2026. "Correcting Measurement Error Bias in Conjoint Survey Experiments." American Journal of Political Science, Pp. 1–19. [https://doi.org/10.1111/ajps.70076](https://doi.org/10.1111/ajps.70076). [https://GaryKing.org/conjointE](https://GaryKing.org/conjointE).Article Appendix Publisher's Version
+ Abstract
Conjoint survey designs are spreading across the social sciences due to their unusual capacity to estimate many causal effects from a single randomized experiment. Unfortunately, by their ability to mirror complicated real-world choices, these designs often generate substantial measurement error and thus bias. We first present a simplified statistical framework for conjoint designs that also enables researchers to study a wider array of substantive questions. We then replicate both the data collection and analysis from eight prominent conjoint studies, all of which closely reproduce published results, and show that a large amount of observed variation in answers to conjoint questions is effectively random noise. We then discover a common empirical pattern in how measurement error appears in conjoint studies and, with it, we introduce an easy-to-use statistical method to correct the bias.
Based on joint work available at GaryKing.org/conjointE by Katherine Clayton, Yusaku Horiuchi, Gary King, Aaron Kaufman, and Mayya Komisarchik.
- Georgina Evans, Gary King, Margaret Schwenzfeier, Abhradeep Thakurta. 2023. "Statistically Valid Inferences from Privacy Protected Data." American Political Science Review, 117, 4, Pp. 1275–1290.Article Publisher's Version Appendix
+ Abstract
Venerable procedures used for privacy protection in sharing data within individual companies and governments, within academia, and between sectors have recently been proven massively inadequate (e.g., respondents in de-identified surveys can usually be re-identified). Furthermore, the benefits of getting our data sharing act together go far beyond the university, since unprecedented quantities of data that could help social scientists understand and ameliorate the challenges of human society are presently locked away inside companies, governments, and other organizations, in part because of worries about privacy violations. We address these problems with a general-purpose data access and analysis system with mathematical guarantees of privacy for individuals who may be represented in the data, statistical guarantees for researchers seeking insights from it, and protection for society from some fallacious scientific conclusions. We build on the standard of “differential privacy’’ but, unlike most such approaches, we also correct for the serious statistical biases induced by privacy-preserving procedures, provide a proper accounting for statistical uncertainty, and impose minimal constraints on the choice of data analytic methods and types of quantities estimated. Our algorithm is easy to implement, simple to use, and computationally efficient; we also offer open source software to illustrate all our methods.
Based on papers (each joint with subsets of Georgie Evans, Meg Schwenzfeier, Adam Smith, and Abhradeep Thakurta) available at GaryKing.org/privacy.
- Matthew Blackwell, James Honaker, Gary King. 2017. "A Unified Approach to Measurement Error and Missing Data: Details and Extensions." Sociological Methods & Research, 46, 3, Pp. 342–369.Article Publisher's Version
+ Abstract
We extend a unified and easy-to-use approach to measurement error and missing data. In our companion article, Blackwell, Honaker, and King give an intuitive overview of the new technique, along with practical suggestions and empirical applications. Here, we offer more precise technical details, more sophisticated measurement error model specifications and estimation procedures, and analyses to assess the approach’s robustness to correlated measurement errors and to errors in categorical variables. These results support using the technique to reduce bias and increase efficiency in a wide variety of empirical research.
Replication data at the Harvard Dataverse: https://doi.org/10.7910/DVN/29610.
- Matthew Blackwell, James Honaker, Gary King. 2017. "A Unified Approach to Measurement Error and Missing Data: Overview and Applications." Sociological Methods & Research, 46, 3, Pp. 303–341.Article Publisher's Version
+ Abstract
Although social scientists devote considerable effort to mitigating measurement error during data collection, they often ignore the issue during data analysis. And although many statistical methods have been proposed for reducing measurement error-induced biases, few have been widely used because of implausible assumptions, high levels of model dependence, difficult computation, or inapplicability with multiple mismeasured variables. We develop an easy-to-use alternative without these problems; it generalizes the popular multiple imputation (MI) framework by treating missing data problems as a limiting special case of extreme measurement error, and corrects for both. Like MI, the proposed framework is a simple two-step procedure, so that in the second step researchers can use whatever statistical method they would have if there had been no problem in the first place. We also offer empirical illustrations, open source software that implements all the methods described herein, and a companion paper with technical details and extensions (Blackwell, Honaker, and King, 2017b).
Replication data at the Harvard Dataverse: https://doi.org/10.7910/DVN/29606.
- James Honaker, Gary King. 2010. "What to Do About Missing Values in Time Series Cross-Section Data." American Journal of Political Science, 54, 3, Pp. 561-81.Article
+ Abstract
Applications of modern methods for analyzing data with missing values, based primarily on multiple imputation, have in the last half-decade become common in American politics and political behavior. Scholars in these fields have thus increasingly avoided the biases and inefficiencies caused by ad hoc methods like listwise deletion and best guess imputation. However, researchers in much of comparative politics and international relations, and others with similar data, have been unable to do the same because the best available imputation methods work poorly with the time-series cross-section data structures common in these fields. We attempt to rectify this situation. First, we build a multiple imputation model that allows smooth time trends, shifts across cross-sectional units, and correlations over time and space, resulting in far more accurate imputations. Second, we build nonignorable missingness models by enabling analysts to incorporate knowledge from area studies experts via priors on individual missing cell values, rather than on difficult-to-interpret model parameters. Third, since these tasks could not be accomplished within existing imputation algorithms, in that they cannot handle as many variables as needed even in the simpler cross-sectional data for which they were designed, we also develop a new algorithm that substantially expands the range of computationally feasible data types and sizes for which multiple imputation can be used. These developments also made it possible to implement the methods introduced here in freely available open source software that is considerably more reliable than existing strategies.
Replication data at the Harvard Dataverse: https://doi.org/10.7910/DVN/GGUR0P.
- James Honaker, Gary King, Jonathan N. Katz. 2002. "A Fast, Easy, and Efficient Estimator for Multiparty Electoral Data." Political Analysis, 10, Pp. 84–100.Article
+ Abstract
Katz and King (1999) develop a model for predicting or explaining aggregate electoral results in multiparty democracies. This model is, in principle, analogous to what least squares regression provides American politics researchers in that two-party system. Katz and King applied this model to three-party elections in England and revealed a variety of new features of incumbency advantage and where each party pulls support from. Although the mathematics of their statistical model covers any number of political parties, it is computationally very demanding, and hence slow and numerically imprecise, with more than three. The original goal of our work was to produce an approximate method that works quicker in practice with many parties without making too many theoretical compromises. As it turns out, the method we offer here improves on Katz and King’s (in bias, variance, numerical stability, and computational speed) even when the latter is computationally feasible. We also offer easy-to-use software that implements our suggestions.
Replication data at the Harvard Dataverse: https://doi.org/10.7910/DVN/F06OSQ.
- Gary King, James Honaker, Anne Joseph, Kenneth Scheve. 2001. "Analyzing Incomplete Political Science Data: An Alternative Algorithm for Multiple Imputation." American Political Science Review, 95, Pp. 49–69.Article
+ Abstract
We propose a remedy for the discrepancy between the way political scientists analyze data with missing values and the recommendations of the statistics community. Methodologists and statisticians agree that “multiple imputation” is a superior approach to the problem of missing data scattered through one’s explanatory and dependent variables than the methods currently used in applied data analysis. The discrepancy occurs because the computational algorithms used to apply the best multiple imputation models have been slow, difficult to implement, impossible to run with existing commercial statistical packages, and have demanded considerable expertise. We adapt an algorithm and use it to implement a general-purpose, multiple imputation model for missing data. This algorithm is considerably easier to use than the leading method recommended in statistics literature. We also quantify the risks of current missing data practices, illustrate how to use the new procedure, and evaluate this alternative through simulated data as well as actual empirical examples. Finally, we offer easy-to-use that implements our suggested methods. (Software: AMELIA)Winner of theISI Emerging Research Front Article, for an article cited more often in in the field than any other, 2002, Thomson Reuters’ ScienceWatch. - Jonathan Katz, Gary King. 1999. "A Statistical Model for Multiparty Electoral Data." American Political Science Review, 93, Pp. 15–32.Article
+ Abstract
We propose a comprehensive statistical model for analyzing multiparty, district-level elections. This model, which provides a tool for comparative politics research analagous to that which regression analysis provides in the American two-party context, can be used to explain or predict how geographic distributions of electoral results depend upon economic conditions, neighborhood ethnic compositions, campaign spending, and other features of the election campaign or aggregate areas. We also provide new graphical representations for data exploration, model evaluation, and substantive interpretation. We illustrate the use of this model by attempting to resolve a controversy over the size of and trend in electoral advantage of incumbency in Britain. Contrary to previous analyses, all based on measures now known to be biased, we demonstrate that the advantage is small but meaningful, varies substantially across the parties, and is not growing. Finally, we show how to estimate the party from which each party’s advantage is predominantly drawn. Winner of the Pi Sigma Alpha Awardfor the best paper at the previous year’s meetings of the Midwest Political Science Association, 1998.
Replication data at the Harvard Dataverse: https://doi.org/10.7910/DVN/NDS9AT.
- Andrew Gelman, Gary King, Chuanhai Liu. 1999. "Not Asked and Not Answered: Multiple Imputation for Multiple Surveys." Journal of the American Statistical Association, 93, Pp. 846–857.Article
+ Abstract
We present a method of analyzing a series of independent cross-sectional surveys in which some questions are not answered in some surveys and some respondents do not answer some of the questions posed. The method is also applicable to a single survey in which different questions are asked or different sampling methods are used in different strata or clusters. Our method involves multiply imputing the missing items and questions by adding to existing methods of imputation designed for single surveys a hierarchical regression model that allows covariates at the individual and survey levels. Information from survey weights is exploited by including in the analysis the variables on which the weights are based, and then reweighting individual responses (observed and imputed) to estimate population quantities. We also develop diagnostics for checking the fit of the imputation model based on comparing imputed data to nonimputed data. We illustrate with the example that motivated this project: a study of pre-election public opinion polls in which not all the questions of interest are asked in all the surveys, so that it is infeasible to impute within each survey separately. Winner of the Outstanding Statistical Application Award, for the outstanding application of statistics in any substantive field, from the American Statistical Association, 2000.
Software
- James Honaker, Gary King, Matthew Blackwell. 2011. "Amelia II: A Program for Missing Data." Journal of Statistical Software, 45, 7, Pp. 1-47.Article
+ Abstract
Amelia II is a complete R package for multiple imputation of missing data. The package implements a new expectation-maximization with bootstrapping algorithm that works faster, with larger numbers of variables, and is far easier to use, than various Markov chain Monte Carlo approaches, but gives essentially the same answers. The program also improves imputation models by allowing researchers to put Bayesian priors on individual cell values, thereby including a great deal of potentially valuable and extensive information. It also includes features to accurately impute cross-sectional datasets, individual time series, or sets of time series for different cross-sections. A full set of graphical diagnostics are also available. The program is easy to use, and the simplicity of the algorithm makes it far more robust; both a simple command line and extensive graphical user interface are included.
- James Honaker, Gary King, Matthew Blackwell. 2009. "AMELIA II: A Program for Missing Data."
+ Abstract
Amelia II is a complete R package for multiple imputation of missing data. The package implements a new expectation-maximization with bootstrapping algorithm that works faster, with larger numbers of variables, and is far easier to use, than various Markov chain Monte Carlo approaches, but gives essentially the same answers. The program also improves imputation models by allowing researchers to put Bayesian priors on individual cell values, thereby including a great deal of potentially valuable and extensive information. It also includes features to accurately impute cross-sectional datasets, individual time series, or sets of time series for different cross-sections. A full set of graphical diagnostics are also available. The program is easy to use, and the simplicity of the algorithm makes it far more robust; both a simple command line and extensive graphical user interface are included.
- Kosuke Imai, Gary King, Olivia Lau. 2006. "Zelig: Everyone's Statistical Software."
- Michael Tomz, Jason Wittenberg, Gary King. 2003. "CLARIFY: Software for Interpreting and Presenting Statistical Results." Journal of Statistical Software, 8(1).
+ Abstract
This is a set of easy-to-use tools that implement the techniques described in Gary King, Michael Tomz, and Jason Wittenberg’s “Making the Most of Statistical Analyses: Improving Interpretation and Presentation.” Winner of the Okidata Best Research Software Award from the American Political Science Association. These tools use Monte Carlo simulations to compute interpretable quantities from regression models and perform inference on them. For Stata, see the Journal of Statistical Software article (doi:10.18637/jss.v008.i01); for current R implementations, see https://iqss.github.io/clarify
How Surveys Work
- D. Steven Voss, Andrew Gelman, Gary King. 1995. "Pre-Election Survey Methodology: Details From Nine Polling Organizations, 1988 and 1992." Public Opinion Quarterly, 59, Pp. 98–132.Article
+ Abstract
Before every presidential election, journalists, pollsters, and politicians commission dozens of public opinion polls. Although the primary function of these surveys is to forecast the election winners, they also generate a wealth of political data valuable even after the election. These preelection polls are useful because they are conducted with such frequency that they allow researchers to study change in estimates of voter opinion within very narrow time increments (Gelman and King 1993). Additionally, so many are conducted that the cumulative sample size of these polls is large enough to construct aggregate measures of public opinion within small demographic or geographical groupings (Wright, Erikson, and McIver 1985).These advantages, however, are mitigated by the decentralized origin of the many preelection polls. The surveys are conducted by diverse private enterprises with procedures that differ significantly. Moreover, important methodological detail does not appear in the public record. Codebooks provided by the survey organizations are all incomplete; many are outdated and most are at least partly inaccurate. The most recent treatment in the academic literature, by Brady and Orren (1992), discusses the approach used by three companies but conceals their identities and omits most of the detail. …
Qualitative Research 🔗
How the same unified theory of inference underlies quantitative and qualitative research alike; scientific inference when quantification is difficult or impossible; research design; empirical research in legal scholarship.
Scientific Inference in Qualitative Research
- Gary King, Robert O. Keohane, Sidney Verba. 2021. "Designing Social Inquiry: Scientific Inference in Qualitative Research, New Edition." Princeton University Press, Princeton, NJ.Publisher's Version
+ Abstract
“The classic work on qualitative methods in political science”
Designing Social Inquiry presents a unified approach to qualitative and quantitative research in political science, showing how the same logic of inference underlies both. This stimulating book discusses issues related to framing research questions, measuring the accuracy of data and the uncertainty of empirical inferences, discovering causal effects, and getting the most out of qualitative research. It addresses topics such as interpretation and inference, comparative case studies, constructing causal theories, dependent and explanatory variables, the limits of random selection, selection bias, and errors in measurement. The book only uses mathematical notation to clarify concepts, and assumes no prior knowledge of mathematics or statistics.
Featuring a new preface by Robert O. Keohane and Gary King, this edition makes an influential work available to new generations of qualitative researchers in the social sciences.
Replication data at the Harvard Dataverse: https://doi.org/10.7910/DVN/YHZG5M.
- Gary King, Eleanor Neff Powell. 2008. "How Not to Lie Without Statistics."Article
+ Abstract
We highlight, and suggest ways to avoid, a large number of common misunderstandings in the literature about best practices in qualitative research. We discuss these issues in four areas: theory and data, qualitative and quantitative strategies, causation and explanation, and selection bias. Some of the misunderstandings involve incendiary debates within our discipline that are readily resolved either directly or with results known in research areas that happen to be unknown to political scientists. Many of these misunderstandings can also be found in quantitative research, often with different names, and some of which can be fixed with reference to ideas better understood in the qualitative methods literature. Our goal is to improve the ability of quantitatively and qualitatively oriented scholars to enjoy the advantages of insights from both areas. Thus, throughout, we attempt to construct specific practical guidelines that can be used to improve actual qualitative research designs, not only the qualitative methods literatures that talk about them. - Gary King, Robert Keohane, Sidney Verba. 1995. "The Importance of Research Design in Political Science." American Political Science Review, 89, Pp. 454–481.Article
+ Abstract
Receiving five serious reviews in this symposium is gratifying and confirms our belief that research design should be a priority for our discipline. We are pleased that our five distinguished reviewers appear to agree with our unified approach to the logic of inference in the social sciences, and with our fundamental point: that good quantitative and good qualitative research designs are based fundamentally on the same logic of inference. The reviewers also raised virtually no objections to the main practical contribution of our book– our many specific procedures for avoiding bias, getting the most out of qualitative data, and making reliable inferences. However, the reviews make clear that although our book may be the latest word on research design in political science, it is surely not the last. We are taxed for failing to include important issues in our analysis and for dealing inadequately with some of what we included. Before responding to the reviewers’ more direct criticisms, let us explain what we emphasize in Designing Social Inquiry and how it relates to some of the points raised by the reviewers. - Gary King, Robert O. Keohane, Sidney Verba. 1994. "Designing Social Inquiry: Scientific Inference in Qualitative Research." Princeton University Press, Princeton, NJ.Publisher's Version
+ Abstract
Designing Social Inquiry presents a unified approach to qualitative and quantitative research in political science, showing how the same logic of inference underlies both. This stimulating book discusses issues related to framing research questions, measuring the accuracy of data and the uncertainty of empirical inferences, discovering causal effects, and getting the most out of qualitative research. It addresses topics such as interpretation and inference, comparative case studies, constructing causal theories, dependent and explanatory variables, the limits of random selection, selection bias, and errors in measurement. The book only uses mathematical notation to clarify concepts, and assumes no prior knowledge of mathematics or statistics.
See the 2021 edition.
In Legal Research
- Lee Epstein, Gary King. 2003. "Building An Infrastructure for Empirical Research in the Law." Journal of Legal Education, 53, Pp. 311–320.Article
+ Abstract
In every discipline in which “empirical research” has become commonplace, scholars have formed a subfield devoted to solving the methodological problems unique to that discipline’s data and theoretical questions. Although students of economics, political science, psychology, sociology, business, education, medicine, public health, and so on primarily focus on specific substantive questions, they cannot wait for those in other fields to solve their methoodological problems or to teach them “new” methods, wherever they were initially developed. In “The Rules of Inference,” we argued for the creation of an analogous methodological subfield devoted to legal scholarship. We also had two other objectives: (1) to adapt the rules of inference used in the natural and social sciences, which apply equally to quantitative and qualitative research, to the special needs, theories, and data in legal scholarship, and (2) to offer recommendations on how the infrastructure of teaching and research at law schools might be reorganized so that it could better support the creation of first-rate quantitative and qualitative empirical research without compromising other important objectives. Published commentaries on our paper, along with citations to it, have focused largely on the first-our application of the rules of inference to legal scholarship. Until now, discussions of our second goal-suggestions for the improvement of legal scholarship, as well as our argument for the creation of a group that would focus on methodological problems unique to law-have been relegated to less public forums, even though, judging from the volume of correspondence we have received, they seem to be no less extensive. - Lee Epstein, Gary King. 2002. "The Rules of Inference." University of Chicago Law Review, 69, Pp. 1–209.Article
+ Abstract
Although the term “empirical research” has become commonplace in legal scholarship over the past two decades, law professors have, in fact, been conducting research that is empirical – that is, learning about the world using quantitative data or qualitative information – for almost as long as they have been conducting research. For just as long, however, they have been proceeding with little awareness of, much less compliance with, the rules of inference, and without paying heed to the key lessons of the revolution in empirical analysis that has been taking place over the last century in other disciplines. The tradition of including some articles devoted to exclusively to the methododology of empirical analysis – so well represented in journals in traditional academic fields – is virtually nonexistent in the nation’s law reviews. As a result, readers learn considerably less accurate information about the empirical world than the studies’ stridently stated, but overconfident, conclusions suggest. To remedy this situation both for the producers and consumers of empirical work, this Article adapts the rules of inference used in the natural and social sciences to the special needs, theories, and data in legal scholarship, and explicate them with extensive illustrations from existing research. The Article also offers suggestions for how the infrastructure of teaching and research at law schools might be reorganized so that it can better support the creation of first-rate empirical research without compromising other important objectives. - Lee Epstein, Gary King. 2002. "Empirical Research and The Goals of Legal Scholarship: A Response." University of Chicago Law Review, 69, Pp. 1–209.Article
+ Abstract
Although the term “empirical research” has become commonplace in legal scholarship over the past two decades, law professors have, in fact, been conducting research that is empirical – that is, learning about the world using quantitative data or qualitative information – for almost as long as they have been conducting research. For just as long, however, they have been proceeding with little awareness of, much less compliance with, the rules of inference, and without paying heed to the key lessons of the revolution in empirical analysis that has been taking place over the last century in other disciplines. The tradition of including some articles devoted to exclusively to the methododology of empirical analysis – so well represented in journals in traditional academic fields – is virtually nonexistent in the nation’s law reviews. As a result, readers learn considerably less accurate information about the empirical world than the studies’ stridently stated, but overconfident, conclusions suggest. To remedy this situation both for the producers and consumers of empirical work, this Article adapts the rules of inference used in the natural and social sciences to the special needs, theories, and data in legal scholarship, and explicate them with extensive illustrations from existing research. The Article also offers suggestions for how the infrastructure of teaching and research at law schools might be reorganized so that it can better support the creation of first-rate empirical research without compromising other important objectives. - Gary King. 1996. "Why Context Should Not Count." Political Geography, 15, Pp. 159–164.Article
+ Abstract
This paper is an invited comment on a paper by John Agnew. I largely agree with Agnew’s comments and thus focus on remaining areas wehre an alternative perspective might be useful. My argument is that political geographers should not be so concerned with demonstrating that context matters. My reasoning is based on three arguments. First, in fact context rarely counts (Section 1) and, second, the most productive practical goal for political researchers should be to show that it does not count (Section 2). Finally, a disproportionate focus on ‘context counting’ can lead, and has led, to some seriosu problems in practical research situations, such as attempting to give theoretical answers to empirical questions (Section 3) and empirical answers to theoretical questions (Section 4).
Rare Events 🔗
How to save 99% of your data collection costs; bias corrections for logistic regression in estimating probabilities and causal effects in rare events data; estimating base probabilities or any quantity from case-control data; automated coding of events.
Articles
- Gary King, Langche Zeng, Shein-Chung Chow. 2010. "Inference in Case Control Studies." In Encyclopedia of Biopharmaceutical Statistics, 3rd ed. New York: Marcel Dekker.Book Chapter
+ Abstract
Classic (or “cumulative”) case-control sampling designs do not admit inferences about quantities of interest other than risk ratios, and then only by making the rare events assumption. Probabilities, risk differences, and other quantities cannot be computed without knowledge of the population incidence fraction. Similarly, density (or “risk set”) case-control sampling designs do not allow inferences about quantities other than the rate ratio. Rates, rate differences, cumulative rates, risks, and other quantities cannot be estimated unless auxiliary information about the underlying cohort such as the number of controls in each full risk set is available. Most scholars who have considered the issue recommend reporting more than just the relative risks and rates, but auxiliary population information needed to do this is not usually available. We address this problem by developing methods that allow valid inferences about all relevant quantities of interest from either type of case-control study when completely ignorant of or only partially knowledgeable about relevant auxiliary population information. This is a somewhat revised and extended version of Gary King and Langche Zeng. 2002. “Estimating Risk and Rate Levels, Ratios, and Differences in Case-Control Studies,” Statistics in Medicine, 21: 1409-1427. You may also be interested in our related work in other fields, such as in international relations, Gary King and Langche Zeng. “Explaining Rare Events in International Relations,” International Organization, 55, 3 (Spring, 2001): 693-715, and in political methodology, Gary King and Langche Zeng, “Logistic Regression in Rare Events Data,” Political Analysis, Vol. 9, No. 2, (Spring, 2001): Pp. 137–63. - Gary King, Langche Zeng. 2002. "Estimating Risk and Rate Levels, Ratios, and Differences in Case-Control Studies." Statistics in Medicine, 21, 10, Pp. 1409–1427.Article
+ Abstract
Classic (or “cumulative”) case-control sampling designs do not admit inferences about quantities of interest other than risk ratios, and then only by making the rare events assumption. Probabilities, risk differences, and other quantities cannot be computed without knowledge of the population incidence fraction. Similarly, density (or “risk set”) case-control sampling designs do not allow inferences about quantities other than the rate ratio. Rates, rate differences, cumulative rates, risks, and other quantities cannot be estimated unless auxiliary information about the underlying cohort such as the number of controls in each full risk set is available. Most scholars who have considered the issue recommend reporting more than just the relative risks and rates, but auxiliary population information needed to do this is not usually available. We address this problem by developing methods that allow valid inferences about all relevant quantities of interest from either type of case-control study when completely ignorant of or only partially knowledgeable about relevant auxiliary population information. - Gary King, Langche Zeng. 2001. "Explaining Rare Events in International Relations." International Organization, 55, Pp. 693–715.Article
+ Abstract
Some of the most important phenomena in international conflict are coded as “rare events data,” binary dependent variables with dozens to thousands of times fewer events, such as wars, coups, etc., than “nonevents”. Unfortunately, rare events data are difficult to explain and predict, a problem that seems to have at least two sources. First, and most importantly, the data collection strategies used in international conflict are grossly inefficient. The fear of collecting data with too few events has led to data collections with huge numbers of observations but relatively few, and poorly measured, explanatory variables. As it turns out, more efficient sampling designs exist for making valid inferences, such as sampling all available events (e.g., wars) and a tiny fraction of non-events (peace). This enables scholars to save as much as 99% of their (non-fixed) data collection costs, or to collect much more meaningful explanatory variables. Second, logistic regression, and other commonly used statistical procedures, can underestimate the probability of rare events. We introduce some corrections that outperform existing methods and change the estimates of absolute and relative risks by as much as some estimated effects reported in the literature. We also provide easy-to-use methods and software that link these two results, enabling both types of corrections to work simultaneously.
Replication data at the Harvard Dataverse: https://doi.org/10.7910/DVN/RNSU7V.
- Gary King, Langche Zeng. 2001. "Logistic Regression in Rare Events Data." Journal of Statistical Software, 8.Article
+ Abstract
We study rare events data, binary dependent variables with dozens to thousands of times fewer ones (events, such as wars, vetoes, cases of political activism, or epidemiological infections) than zeros (“nonevents”). In many literatures, these variables have proven difficult to explain and predict, a problem that seems to have at least two sources. First, popular statistical procedures, such as logistic regression, can sharply underestimate the probability of rare events. We recommend corrections that outperform existing methods and change the estimates of absolute and relative risks by as much as some estimated effects reported in the literature. Second, commonly used data collection strategies are grossly inefficient for rare events data. The fear of collecting data with too few events has led to data collections with huge numbers of observations but relatively few, and poorly measured, explanatory variables, such as in international conflict data with more than a quarter-million dyads, only a few of which are at war. As it turns out, more efficient sampling designs exist for making valid inferences, such as sampling all variable events (e.g., wars) and a tiny fraction of nonevents (peace). This enables scholars to save as much as 99% of their (nonfixed) data collection costs or to collect much more meaningful explanatory variables. We provide methods that link these two results, enabling both types of corrections to work simultaneously, and software that implements the methods developed.
Replication data at the Harvard Dataverse: https://doi.org/10.7910/DVN/SPAFJK.
- Gary King, Langche Zeng. 2001. "Improving Forecasts of State Failure." World Politics, 53, Pp. 623–658.Article
+ Abstract
We offer the first independent scholarly evaluation of the claims, forecasts, and causal inferences of the State Failure Task Force and their efforts to forecast when states will fail. State failure refers to the collapse of the authority of the central government to impose order, as in civil wars, revolutionary wars, genocides, politicides, and adverse or disruptive regime transitions. This task force, set up at the behest of Vice President Gore in 1994, has been led by a group of distinguished academics working as consultants to the U.S. Central Intelligence Agency. State Failure Task Force reports and publications have received attention in the media, in academia, and from public policy decision-makers. In this article, we identify several methodological errors in the task force work that cause their reported forecast probabilities of conflict to be too large, their causal inferences to be biased in unpredictable directions, and their claims of forecasting performance to be exaggerated. However, we also find that the task force has amassed the best and most carefully collected data on state failure in existence, and the required corrections which we provide, although very large in effect, are easy to implement. We also reanalyze their data with better statistical procedures and demonstrate how to improve forecasting performance to levels significantly greater than even corrected versions of their models. Although still a highly uncertain endeavor, we are as a consequence able to offer the first accurate forecasts of state failure, along with procedures and results that may be of practical use in informing foreign policy decision making. We also describe a number of strong empirical regularities that may help in ascertaining the causes of state failure.
Replication data at the Harvard Dataverse: https://doi.org/10.7910/DVN/BS4236.
- James E. Alt, Gary King, Curtis Signorino. 2001. "Aggregation Among Binary, Count, and Duration Models: Estimating the Same Quantities from Different Levels of Data." Political Analysis, 9, Pp. 21–44.Article
+ Abstract
Binary, count and duration data all code discrete events occurring at points in time. Although a single data generation process can produce all of these three data types, the statistical literature is not very helpful in providing methods to estimate parameters of the same process from each. In fact, only single theoretical process exists for which know statistical methods can estimate the same parameters - and it is generally used only for count and duration data. The result is that seemingly trivial decisions abut which level of data to use can have important consequences for substantive interpretations. We describe the theoretical event process for which results exist, based on time independence. We also derive a set of models for a time-dependent process and compare their predictions to those of a commonly used model. Any hope of understanding and avoiding the more serious problems of aggregation bias in events data is contingent on first deriving a much wider arsenal of statistical models and theoretical processes that are not constrained by the particular forms of data that happen to be available. We discuss these issues and suggest an agenda for political methodologists interested in this very large class of aggregation problems.
Replication data at the Harvard Dataverse: https://doi.org/10.7910/DVN/UDRSQ6.
- Andrew Gelman, Gary King, John Boscardin. 1998. "Estimating the Probability of Events That Have Never Occurred: When Is Your Vote Decisive?." Journal of the American Statistical Association, 93, Pp. 1–9.Article
+ Abstract
Researchers sometimes argue that statisticians have little to contribute when few realizations of the process being estimated are observed. We show that this argument is incorrect even in the extreme situation of estimating the probabilities of events so rare that they have never occurred. We show how statistical forecasting models allow us to use empirical data to improve inferences about the probabilities of these events. Our application is estimating the probability that your vote will be decisive in a U.S. presidential election, a problem that has been studied by political scientists for more than two decades. The exact value of this probability is of only minor interest, but the number has important implications for understanding the optimal allocation of campaign resources, whether states and voter groups receive their fair share of attention from prospective presidents, and how formal “rational choice” models of voter behavior might be able to explain why people vote at all. We show how the probability of a decisive vote can be estimated empirically from state-level forecasts of the presidential election and illustrate with the example of 1992. Based on generalizations of standard political science forecasting models, we estimate the (prospective) probability of a single vote being decisive as about 1 in 10 million for close national elections such as 1992, varying by about a factor of 10 among states. Our results support the argument that subjective probabilities of many types are best obtained through empirically based statistical prediction models rather than solely through mathematical reasoning. We discuss the implications of our findings for the types of decision analyses used in public choice studies.
Replication data at the Harvard Dataverse: https://doi.org/10.7910/DVN/0FT6ZL.
Software
- Kosuke Imai, Gary King, Olivia Lau. 2006. "Zelig: Everyone's Statistical Software."
- Michael Tomz, Gary King, Langche Zeng. 2003. "ReLogit: Rare Events Logistic Regression."
Data
- Gary King. 2003. "10 Million International Dyadic Events."
Survey Research 🔗
How surveys work and a variety of methods to use with surveys. Surveys for estimating death rates, why election polls are so variable when the vote is so predictable, and health inequality.
- Musashi Hinck, Gary King, Kentaro Nakamura, Brandon M. Stewart. 2026. "Where's the Evidence that Respondents Understand Your Survey Questions?."Article Appendix
+ Abstract
Survey researchers try to align respondent question interpretations with their own by applying theoretical rules, such as writing questions simply, concretely, and without biasing words or double-barreled inquiries, or via post hoc plausibility checks. Few, however, conduct ex ante empirical evaluations of their application of these rules. The widely recognized best empirical approach is “cognitive debriefing,” that follows a survey question with a detailed conversation with the respondent. Unfortunately, this time-consuming procedure is rarely used, especially for novel surveys on online platforms. This paradoxically leaves the veracity of the discipline’s most used empirical methodology depending largely on theoretical assumptions. For cognitive debriefing to live up to its intended potential, we first formalize the essential interpretation-related assumptions underlying all survey questions. We then automate cognitive debriefing to satisfy these assumptions using a specially-tuned chatbot, apply it to larger numbers than heretofore possible, analyze the collection of transcripts, and summarize the interpretations it reveals. By iteratively rewriting questions and rerunning this procedure, researchers can help ensure respondents understand questions as they do. We also apply our procedure to some of the most common survey questions and demonstrate large disconnects between researcher intentions and respondent understandings. We make available easy-to-use open source software that implements all our suggestions. - Libby Jenke, Gary King. 2026. "Who's to Blame for Survey Instability: Respondents with Nonexistent Preferences or Researchers with Flawed Measures?."Article Appendix
+ Abstract
Neither. For at least 75 years, survey researchers have found that about 25% of respondents give different answers when asked the same question twice (even if no material changes occur and respondents do not remember being asked the first time). This “survey instability” problem casts doubt on a vast research enterprise spanning large areas of academia and industry, is core to many ongoing substantive debates, and requires a resolution for proper survey design and analysis methods. We collect a wide variety of observational and experimental evidence, including 59 unique surveys. We first show that instability barely drops after accounting for both existing explanations, i.e., when respondents have fixed knowledge of their preferences and researchers use high quality, unbiased survey instruments. We trace a large component of survey instability to a different source recognized only in fields with non-survey measurement instruments — intrinsic human stochasticity. We then trace the decision making, cognitive, psychological, and individual characteristic precursors of this stochasticity and reveal their wide ranging implications for understanding respondents, avoiding inattention, designing surveys, and building statistical analysis methods. - Gary King, Mitsuru Mukaigawara. 2025. "Survey Estimates of Wartime Mortality."Article Appendix
+ Abstract
Many scholarly literatures require mortality rates from conflict zones, but accurate information is usually among the earliest casualties of war. While political scientists typically obtain mortality data from the news media or others, much progress has been made in demography, epidemiology, and public health conducting original surveys about the survival of siblings, friends, or others known to respondents. Unfortunately, the formal properties of estimators based on these surveys have not been established, the intuitions offered for them (and consequent data analysis strategies) are conflicting, and the statistical consequences of the political incentives of respondents in conflict zones remain unexamined. In this paper, we demonstrate the advantages of joining ongoing efforts in these other fields with insights from political science, including especially political methodology, international relations, and comparative politics. We offer the first formal proofs of the statistical properties of all existing estimators, along with simulation and empirical illustrations, to craft simple intuitions to guide best practices. We also build practical data analytic approaches, based on modern robust statistical methods, for when some respondents are suspected of intentionally biasing answers for political, military, or other strategic purposes. We offer practical advice for producing more complete and accurate mortality inferences for scholarship in our discipline and beyond. Software to implement all the methods in this paper, TrimSib, is available here. - Musashi Hinck, Uma Ilavarasan, Gary King, Kentaro Nakamura, Brandon M. Stewart. 2024. "Automated Cognitive Debriefing."Poster
+ Abstract
Cognitive debriefing: necessary for researchers & respondents to agree on question meaning but prohibitively expensive, so rarely used.
- Administer survey, then go back & discuss what respondent thinks each question means.
- Universally-recommended best practice.
Our goal: easily & drastically improve question wording through an automated cognitive debriefing tool (ACD tool).
- Georgina Evans, Gary King, Adam D. Smith, Abhradeep Thakurta. 2024. "Differentially Private Survey Research." American Journal of Political Science, 70, 1, Pp. 90–103.Article Publisher's Version Appendix
+ Abstract
Survey researchers have long sought to protect the privacy of their respondents via de-identification (removing names and other directly identifying information) before sharing data. Although these procedures can help, recent research demonstrates that they fail to protect respondents from intentional re-identification attacks, a problem that threatens to undermine vast survey enterprises in academia, government, and industry. This is especially a problem in political science because political beliefs are not merely the subject of our scholarship; they represent some of the most important information respondents want to keep private. We confirm the problem in practice by re-identifying individuals from a survey about a controversial referendum declaring life beginning at conception. We build on the concept of “differential privacy” to offer new data sharing procedures with mathematical guarantees for protecting respondent privacy and statistical validity guarantees for social scientists analyzing differentially private data. The cost of these new procedures is larger standard errors, which can be overcome with somewhat larger sample sizes.
Replication data at the Harvard Dataverse: https://doi.org/10.7910/DVN/X4Y2FL.
- Aaron Kaufman, Gary King, Mayya Komisarchik. 2021. "How to Measure Legislative District Compactness If You Only Know It When You See It." American Journal of Political Science, 65, 3, Pp. 533–550.Article Publisher's Version Appendix
+ Abstract
The US Supreme Court, many state constitutions, and numerous judicial opinions require that legislative districts be “compact,” a concept assumed so simple that the only definition given in the law is “you know it when you see it.” Academics, in contrast, have concluded that the concept is so complex that it has multiple theoretical dimensions requiring large numbers of conflicting empirical measures. We hypothesize that both are correct – that the concept is complex and multidimensional, but one particular unidimensional ordering represents a common understanding of compactness in the law and across people. We develop a survey method designed to elicit this understanding with high levels of intracoder and intercoder reliability (even though the standard paired comparison approach fails). We then create a statistical model that predicts, with high accuracy and solely from the geometric features of the district, compactness evaluations by judges and other public officials from many jurisdictions, as well as redistricting consultants and expert witnesses, law professors, law students, graduate students, undergraduates, ordinary citizens, and Mechanical Turk workers. As a companion to this paper, we offer data on compactness from our validated measure for 18,215 US state legislative and congressional districts, as well as software to compute this measure from any district shape. We also discuss what may be the wider applicability of our general methodological approach to measuring important concepts that you only know when you see. - Soubhik Barari, Stefano Caria, Antonio Davola, Paolo Falco, Thiemo Fetzer, Stefano Fiorin, Lukas Hensel, Andriy Ivchenko, Jon Jachimowicz, Gary King, Gordon Kraft-Todd, Alice Ledda, Mary MacLennan, Lucian Mutoi, Claudio Pagani, Elena Reutskaja, Christopher Roth, Federico Raimondi Slepoi. 2020. "Evaluating COVID-19 Public Health Messaging in Italy: Self-Reported Compliance and Growing Mental Health Concerns."Article
+ Abstract
Purpose: The COVID-19 death-rate in Italy continues to climb, surpassing that in every other country. We implement one of the first nationally representative surveys about this unprecedented public health crisis and use it to evaluate the Italian government’ public health efforts and citizen responses. Findings: (1) Public health messaging is being heard. Except for slightly lower compliance among young adults, all subgroups we studied understand how to keep themselves and others safe from the SARS-Cov-2 virus. Remarkably, even those who do not trust the government, or think the government has been untruthful about the crisis believe the messaging and claim to be acting in accordance. (2) The quarantine is beginning to have serious negative effects on the population’s mental health. Policy Recommendations: Communications focus should move from explaining to citizens that they should stay at home to what they can do there. We need interventions that make staying at home and following public health protocols more desirable. These interventions could include virtual social interactions, such as online social reading activities, classes, exercise routines, etc. — all designed to reduce the boredom of long term social isolation and to increase the attractiveness of following public health recommendations. Interventions like these will grow in importance as the crisis wears on around the world, and staying inside wears on people.
Replication data at the Harvard Dataverse: https://doi.org/10.7910/DVN/1SBQCX.
- Edward Goldstein, Benjamin Cowling, Allison Aiello, Saki Takahashi, Gary King, Ying Lu, Marc Lipsitch. 2011. "Estimating Incidence Curves of Several Infections Using Symptom Surveillance Data." PLoS ONE, 6, 8, Pp. e23380.Article Publisher's Version
+ Abstract
We introduce a method for estimating incidence curves of several co-circulating infectious pathogens, where each infection has its own probabilities of particular symptom profiles. Our deconvolution method utilizes weekly surveillance data on symptoms from a defined population as well as additional data on symptoms from a sample of virologically confirmed infectious episodes. We illustrate this method by numerical simulations and by using data from a survey conducted on the University of Michigan campus. Last, we describe the data needs to make such estimates accurate.
- Gary King, Ying Lu, Kenji Shibuya. 2010. "Designing Verbal Autopsy Studies." Population Health Metrics, 8, 1, Pp. 19.Article
+ Abstract
Background: Verbal autopsy analyses are widely used for estimating cause-specific mortality rates (CSMR) in the vast majority of the world without high quality medical death registration. Verbal autopsies – survey interviews with the caretakers of imminent decedents – stand in for medical examinations or physical autopsies, which are infeasible or culturally prohibited. Methods and Findings: We introduce methods, simulations, and interpretations that can improve the design of automated, data-derived estimates of CSMRs, building on a new approach by King and Lu (2008). Our results generate advice for choosing symptom questions and sample sizes that is easier to satisfy than existing practices. For example, most prior effort has been devoted to searching for symptoms with high sensitivity and specificity, which has rarely if ever succeeded with multiple causes of death. In contrast, our approach makes this search irrelevant because it can produce unbiased estimates even with symptoms that have very low sensitivity and specificity. In addition, the new method is optimized for survey questions caretakers can easily answer rather than questions physicians would ask themselves. We also offer an automated method of weeding out biased symptom questions and advice on how to choose the number of causes of death, symptom questions to ask, and observations to collect, among others. Conclusions: With the advice offered here, researchers should be able to design verbal autopsy surveys and conduct analyses with greatly reduced statistical biases and research costs. - Gary King, Ying Lu. 2008. "Verbal Autopsy Methods With Multiple Causes of Death." Statistical Science, 23, 1, Pp. 78–91.Article
+ Abstract
Verbal autopsy procedures are widely used for estimating cause-specific mortality in areas without medical death certification. Data on symptoms reported by caregivers along with the cause of death are collected from a medical facility, and the cause-of-death distribution is estimated in the population where only symptom data are available. Current approaches analyze only one cause at a time, involve assumptions judged difficult or impossible to satisfy, and require expensive, time consuming, or unreliable physician reviews, expert algorithms, or parametric statistical models. By generalizing current approaches to analyze multiple causes, we show how most of the difficult assumptions underlying existing methods can be dropped. These generalizations also make physician review, expert algorithms, and parametric statistical assumptions unnecessary. With theoretical results, and empirical analyses in data from China and Tanzania, we illustrate the accuracy of this approach. While no method of analyzing verbal autopsy data, including the more computationally intensive approach offered here, can give accurate estimates in all circumstances, the procedure offered is conceptually simpler, less expensive, more general, as or more replicable, and easier to use in practice than existing approaches. We also show how our focus on estimating aggregate proportions, which are the quantities of primary interest in verbal autopsy studies, may also greatly reduce the assumptions necessary, and thus improve the performance of, many individual classifiers in this and other areas. As a companion to this paper, we also offer easy-to-use software that implements the methods discussed herein. - Emmanuela Gakidou, Gary King. 2006. "Death by Survey: Estimating Adult Mortality Without Selection Bias from Sibling Survival Data." Demography, 43, Pp. 569–585.Presentation
+ Abstract
The widely used methods for estimating adult mortality rates from sample survey responses about the survival of siblings, parents, spouses, and others depend crucially on an assumption that we demonstrate does not hold in real data. We show that when this assumption is violated – so that the mortality rate varies with sibship size – mortality estimates can be massively biased. By using insights from work on the statistical analysis of selection bias, survey weighting, and extrapolation problems, we propose a new and relatively simple method of recovering the mortality rate with both greatly reduced potential for bias and increased clarity about the source of necessary assumptions.
Replication data at the Harvard Dataverse: https://doi.org/10.7910/DVN/TFPPA2.
- Emmanuela Gakidou, Gary King. 2002. "Measuring Total Health Inequality: Adding Individual Variation to Group-Level Differences." BioMed Central: International Journal for Equity in Health, 1.Article
+ Abstract
Background: Studies have revealed large variations in average health status across social, economic, and other groups. No study exists on the distribution of the risk of ill-health across individuals, either within groups or across all people in a society, and as such a crucial piece of total health inequality has been overlooked. Some of the reason for this neglect has been that the risk of death, which forms the basis for most measures, is impossible to observe directly and difficult to estimate. Methods: We develop a measure of total health inequality – encompassing all inequalities among people in a society, including variation between and within groups – by adapting a beta-binomial regression model. We apply it to children under age two in 50 low- and middle-income countries. Our method has been adopted by the World Health Organization and is being implemented in surveys around the world and preliminary estimates have appeared in the World Health Report (2000). Results: Countries with similar average child mortality differ considerably in total health inequality. Liberia and Mozambique have the largest inequalities in child survival, while Colombia, the Philippines and Kazakhstan have the lowest levels among the countries measured. Conclusions: Total health inequality estimates should be routinely reported alongside average levels of health in populations and groups, as they reveal important policy-related information not otherwise knowable. This approach enables meaningful comparisons of inequality across countries and future analyses of the determinants of inequality. - D. Steven Voss, Andrew Gelman, Gary King. 1995. "Pre-Election Survey Methodology: Details From Nine Polling Organizations, 1988 and 1992." Public Opinion Quarterly, 59, Pp. 98–132.Article
+ Abstract
Before every presidential election, journalists, pollsters, and politicians commission dozens of public opinion polls. Although the primary function of these surveys is to forecast the election winners, they also generate a wealth of political data valuable even after the election. These preelection polls are useful because they are conducted with such frequency that they allow researchers to study change in estimates of voter opinion within very narrow time increments (Gelman and King 1993). Additionally, so many are conducted that the cumulative sample size of these polls is large enough to construct aggregate measures of public opinion within small demographic or geographical groupings (Wright, Erikson, and McIver 1985).These advantages, however, are mitigated by the decentralized origin of the many preelection polls. The surveys are conducted by diverse private enterprises with procedures that differ significantly. Moreover, important methodological detail does not appear in the public record. Codebooks provided by the survey organizations are all incomplete; many are outdated and most are at least partly inaccurate. The most recent treatment in the academic literature, by Brady and Orren (1992), discusses the approach used by three companies but conceals their identities and omits most of the detail. … - Andrew Gelman, Gary King. 1993. "Why Are American Presidential Election Campaign Polls so Variable When Votes Are so Predictable?." British Journal of Political Science, 23, Pp. 409–451.Article
+ Abstract
As most political scientists know, the outcome of the U.S. Presidential election can be predicted within a few percentage points (in the popular vote), based on information available months before the election. Thus, the general election campaign for president seems irrelevant to the outcome (except in very close elections), despite all the media coverage of campaign strategy. However, it is also well known that the pre-election opinion polls can vary wildly over the campaign, and this variation is generally attributed to events in the campaign. How can campaign events affect people’s opinions on whom they plan to vote for, and yet not affect the outcome of the election? For that matter, why do voters consistently increase their support for a candidate during his nominating convention, even though the conventions are almost entirely predictable events whose effects can be rationally forecast? In this exploratory study, we consider several intuitively appealing, but ultimately wrong, resolutions to this puzzle, and discuss our current understanding of what causes opinion polls to fluctuate and yet reach a predictable outcome. Our evidence is based on graphical presentation and analysis of over 67,000 individual-level responses from forty-nine commercial polls during the 1988 campaign and many other aggregate poll results from the 1952–1992 campaigns. We show that responses to pollsters during the campaign are not generally informed or even, in a sense we describe, “rational.” In contrast, voters decide which candidate to eventually support based on their enlightened preferences, as formed by the information they have learned during the campaign, as well as basic political cues such as ideology and party identification. We cannot prove this conclusion, but we do show that it is consistent with the aggregate forecasts and individual-level opinion poll responses. Based on the enlightened preferences hypothesis, we conclude that the news media have an important effect on the outcome of Presidential elections–-not due to misleading advertisements, sound bites, or spin doctors, but rather by conveying candidates’ positions on important issues. Winner of the Pi Sigma Alpha Awardfor the best paper at the previous year’s meetings of the Midwest Political Science Association.
Replication data at the Harvard Dataverse: https://doi.org/10.7910/DVN/I7GIKD.
Unifying Statistical Analysis 🔗
Development of a unified approach to statistical modeling, inference, interpretation, presentation, analysis, and software; integrated with most of the other projects listed here.
Unifying Approaches to Statistical Analysis
- Beau Coker, Cynthia Rudin, Gary King. 2021. "A Theory of Statistical Inference for Ensuring the Robustness of Scientific Results." Management Science, 67, 10, Pp. 6174–6197.Article Publisher's Version
+ Abstract
Inference is the process of using facts we know to learn about facts we do not know. A theory of inference gives assumptions necessary to get from the former to the latter, along with a definition for and summary of the resulting uncertainty. Any one theory of inference is neither right nor wrong, but merely an axiom that may or may not be useful. Each of the many diverse theories of inference can be valuable for certain applications. However, no existing theory of inference addresses the tendency to choose, from the range of plausible data analysis specifications consistent with prior evidence, those that inadvertently favor one’s own hypotheses. Since the biases from these choices are a growing concern across scientific fields, and in a sense the reason the scientific community was invented in the first place, we introduce a new theory of inference designed to address this critical problem. We derive “hacking intervals,” which are the range of a summary statistic one may obtain given a class of possible endogenous manipulations of the data. Hacking intervals require no appeal to hypothetical data sets drawn from imaginary superpopulations. A scientific result with a small hacking interval is more robust to researcher manipulation than one with a larger interval, and is often easier to interpret than a classical confidence interval. Some versions of hacking intervals turn out to be equivalent to classical confidence intervals, which means they may also provide a more intuitive and potentially more useful interpretation of classical confidence intervals. - Gary King, Margaret E. Roberts. 2015. "How Robust Standard Errors Expose Methodological Problems They Do Not Fix, and What to Do About It." Political Analysis, 23, 2, Pp. 159–179.Article Publisher's Version
+ Abstract
“Robust standard errors” are used in a vast array of scholarship to correct standard errors for model misspecification. However, when misspecification is bad enough to make classical and robust standard errors diverge, assuming that it is nevertheless not so bad as to bias everything else requires considerable optimism. And even if the optimism is warranted, settling for a misspecified model, with or without robust standard errors, will still bias estimators of all but a few quantities of interest. The resulting cavernous gap between theory and practice suggests that considerable gains in applied statistics may be possible. We seek to help researchers realize these gains via a more productive way to understand and use robust standard errors; a new general and easier-to-use “generalized information matrix test” statistic that can formally assess misspecification (based on differences between robust and classical variance estimates); and practical illustrations via simulations and real examples from published research. How robust standard errors are used needs to change, but instead of jettisoning this popular tool we show how to use it to provide effective clues about model misspecification, likely biases, and a guide to considerably more reliable, and defensible, inferences. Accompanying this article is open source software that implements the methods we describe.
Replication data at the Harvard Dataverse: https://doi.org/10.7910/DVN/26935.
- David Lazer, Ryan Kennedy, Gary King, Alessandro Vespignani. 2014. "Google Flu Trends Still Appears Sick: An Evaluation of the 2013‐2014 Flu Season."Article
+ Abstract
Last year was difficult for Google Flu Trends (GFT). In early 2013, Nature reported that GFT was estimating more than double the percentage of doctor visits for influenza like illness than the Centers for Disease Control and Prevention s (CDC) sentinel reports during the 2012 2013 flu season (1). Given that GFT was designed to forecast upcoming CDC reports, this was a problematic finding. In March 2014, our report in Science found that the overestimation problem in GFT was also present in the 2011 2012 flu season (2). The report also found strong evidence of autocorrelation and seasonality in the GFT errors, and presented evidence that the issues were likely, at least in part, due to modifications made by Google s search algorithm and the decision by GFT engineers not to use previous CDC reports or seasonality estimates in their models what the article labeled algorithm dynamics and big data hubris respectively. Moreover, the report and the supporting online materials detailed how difficult/impossible it is to replicate the GFT results, undermining independent efforts to explore the source of GFT errors and formulate improvements.
See our original paper, “The Parable of Google Flu: Traps in Big Data Analysis”
- David Lazer, Ryan Kennedy, Gary King, Alessandro Vespignani. 2014. "The Parable of Google Flu: Traps in Big Data Analysis." Science, 343, 6176, Pp. 1203–1205.Article Publisher's Version
+ Abstract
Large errors in flu prediction were largely avoidable, which offers lessons for the use of big data.
In February 2013, Google Flu Trends (GFT) made headlines but not for a reason that Google executives or the creators of the flu tracking system would have hoped. Nature reported that GFT was predicting more than double the proportion of doctor visits for influenza-like illness (ILI) than the Centers for Disease Control and Prevention (CDC), which bases its estimates on surveillance reports from laboratories across the United States ( 1, 2). This happened despite the fact that GFT was built to predict CDC reports. Given that GFT is often held up as an exemplary use of big data ( 3, 4), what lessons can we draw from this error?
Replication data at the Harvard Dataverse: https://doi.org/10.7910/DVN/24823.
See also “Google Flu Trends Still Appears Sick: An Evaluation of the 2013‐2014 Flu Season”.
- David Lazer, Ryan Kennedy, Gary King, Alessandro Vespignani. 2014. "Twitter: Big Data Opportunities—Response." Science, 345, 6193, Pp. 148–149.Article Publisher's Version
+ Abstract
WE THANK BRONIATOWSKI, Paul, and Dredze for giving us the opportunity to reemphasize the potential of big data and make the more obvious point that not all big data projects have the problems currently plaguing Google Flu Trends (GFT), nor are these problems inherent to the field in general.
See our original papers: “The Parable of Google Flu: Traps in Big Data Analysis,” and “Google Flu Trends Still Appears Sick: An Evaluation of the 2013‐2014 Flu Season”
- Kosuke Imai, Gary King, Olivia Lau. 2008. "Toward A Common Framework for Statistical Analysis and Development." Journal of Computational and Graphical Statistics, 17, 4, Pp. 892–913.Article
+ Abstract
We describe some progress toward a common framework for statistical analysis and software development built on and within the R language, including R’s numerous existing packages. The framework we have developed offers a simple unified structure and syntax that can encompass a large fraction of statistical procedures already implemented in R, without requiring any changes in existing approaches. We conjecture that it can be used to encompass and present simply a vast majority of existing statistical methods, regardless of the theory of inference on which they are based, notation with which they were developed, and programming syntax with which they have been implemented. This development enabled us, and should enable others, to design statistical software with a single, simple, and unified user interface that helps overcome the conflicting notation, syntax, jargon, and statistical methods existing across the methods subfields of numerous academic disciplines. The approach also enables one to build a graphical user interface that automatically includes any method encompassed within the framework. We hope that the result of this line of research will greatly reduce the time from the creation of a new statistical innovation to its widespread use by applied researchers whether or not they use or program in R. - Kosuke Imai, Gary King, Olivia Lau. 2006. "Zelig: Everyone's Statistical Software."
- Michael Tomz, Jason Wittenberg, Gary King. 2003. "CLARIFY: Software for Interpreting and Presenting Statistical Results." Journal of Statistical Software, 8(1).
+ Abstract
This is a set of easy-to-use tools that implement the techniques described in Gary King, Michael Tomz, and Jason Wittenberg’s “Making the Most of Statistical Analyses: Improving Interpretation and Presentation.” Winner of the Okidata Best Research Software Award from the American Political Science Association. These tools use Monte Carlo simulations to compute interpretable quantities from regression models and perform inference on them. For Stata, see the Journal of Statistical Software article (doi:10.18637/jss.v008.i01); for current R implementations, see https://iqss.github.io/clarify - Gary King, Michael Tomz, Jason Wittenberg. 2000. "Making the Most of Statistical Analyses: Improving Interpretation and Presentation." American Journal of Political Science, 44, Pp. 341–355.Article
+ Abstract
Social Scientists rarely take full advantage of the information available in their statistical results. As a consequence, they miss opportunities to present quantities that are of greatest substantive interest for their research and express the appropriate degree of certainty about these quantities. In this article, we offer an approach, built on the technique of statistical simulation, to extract the currently overlooked information from any statistical method and to interpret and present it in a reader-friendly manner. Using this technique requires some expertise, which we try to provide herein, but its application should make the results of quantitative articles more informative and transparent. To illustrate our recommendations, we replicate the results of several published works, showing in each case how the authors’ own conclusions can be expressed more sharply and informatively, and, without changing any data or statistical assumptions, how our approach reveals important new information about the research questions at hand. We also offer very easy-to-use Clarify software that implements our suggestions.
Replication data at the Harvard Dataverse: https://doi.org/10.7910/DVN/BDWIC3.
- Gary King. 1998. "Unifying Political Methodology: The Likelihood Theory of Statistical Inference." University of Michigan Press, Ann Arbor.Publisher's Site Errata
+ Abstract
“One of the hallmarks of the development of political science as a discipline has been the creation of new methodologies by scholars within the discipline–methodologies that are well-suited to the analysis of political data. Gary King has been a leader in the development of these new approaches to the analysis of political data. In his book, Unifying Political Methodology, King shows how the likelihood theory of inference offers a unified approach to statistical modeling for political research and thus enables us to better analyze the enormous amount of data political scientists have collected over the years. Newly reissued, this book is a landmark in the development of political methodology and continues to challenge scholars and spark controversy.” - Gary King. 1991. "Calculating Standard Errors of Predicted Values Based on Nonlinear Functional Forms." The Political Methodologist, 4.Article
+ Abstract
Whenever we report predicted values, we should also report some measure of the uncertainty of these estimates. In the linear case, this is relatively simple, and the answer well-known, but with nonlinear models the answer may not be apparent. This short article shows how to make these calculations. I first present this for the familiar linear case, also reviewing the two forms of uncertainty in these estimates, and then show how to calculate these for any arbitrary function. An example appears last. - Gary King. 1991. "Stochastic Variation: A Comment on Lewis-Beck and Skalaban's 'The R-Square'." Political Analysis, 2, Pp. 185–200.
+ Abstract
In an interesting and provocative article, Michael Lewis-Beck and Andrew Skalaban make an important contribution by emphasizing several philosophical issues in political methodology that have received too little attention from methodologists and quantitative researchers. These issues involve the role of systematic, and especially stochastic, variation in statistical models. After briefly discussing a few points of disagreement, hoping to reduce them to points of clarification, I turn to the philosophical issues. Examples with real data follow.
Related Materials
- Danny Ebanks, Jonathan N. Katz, Gary King. 2025. "If a Statistical Model Predicts That Common Events Should Occur Only Once in 10,000 Elections, Maybe It's the Wrong Model."Article Appendix
+ Abstract
Political scientists forecast elections, not primarily to satisfy public interest, but to validate statistical models used for estimating many quantities of scholarly interest. Although scholars have learned a great deal from these models, they can be embarrassingly overconfident: Events that should occur once in 10,000 elections occur almost every year, and even those that should occur once in a trillion-trillion elections are sometimes observed. We develop a novel generative statistical model of US congressional elections 1954-2020 and validate it with extensive out-of-sample tests. The generatively accurate descriptive summaries provided by this model demonstrate that the 1950s was as partisan and differentiated as the current period, but with parties not based on ideological differences as they are today. The model also shows that even though the size of the incumbency advantage has varied tremendously over time, the risk of an in-party incumbent losing a midterm election contest has been high and essentially constant over at least the last two thirds of a century.
Please see “How American Politics Ensures Electoral Accountability in Congress,” which supersedes this paper.
- Daniel Gilbert, Gary King, Stephen Pettigrew, Timothy Wilson. 2016. "Comment on 'Estimating the Reproducibility of Psychological Science'." Science, 351, 6277, Pp. 1037a-1038a.Article Publisher's Version Appendix
+ Abstract
A recent article by the Open Science Collaboration (a group of 270 coauthors) gained considerable academic and public attention due to its sensational conclusion that the replicability of psychological science is surprisingly low. *Science *magazine lauded this article as one of the top 10 scientific breakthroughs of the year across all fields of science, reports of which appeared on the front pages of newspapers worldwide. We show that OSC’s article contains three major statistical errors and, when corrected, provides no evidence of a replication crisis. Indeed, the evidence is consistent with the opposite conclusion – that the reproducibility of psychological science is quite high and, in fact, statistically indistinguishable from 100%. (Of course, that doesn’t mean that the replicability is 100%, only that the evidence is insufficient to reliably estimate replicability.) The moral of the story is that meta-science must follow the rules of science.
Replication data is available in this dataverse archive. See also the full web site for this article and related materials, and one of the news articles written about it.
- Gary King. 2009. "The Changing Evidence Base of Social Science Research." In The Future of Political Science: 100 Perspectives, edited by Gary King, Kay Schlozman, and Norman Nie. New York: Routledge Press.Book Chapter
+ Abstract
This (two-page) article argues that the evidence base of political science and the related social sciences are beginning an underappreciated but historic change. - Jeff Gill, Gary King. 2004. "What to Do When Your Hessian Is Not Invertible: Alternatives to Model Respecification in Nonlinear Estimation." Sociological Methods & Research, 33, 1, Pp. 54–87.Article
+ Abstract
What should a researcher do when statistical analysis software terminates before completion with a message that the Hessian is not invertable? The standard textbook advice is to respecify the model, but this is another way of saying that the researcher should change the question being asked. Obviously, however, computer programs should not be in the business of deciding what questions are worthy of study. Although noninvertable Hessians are sometimes signals of poorly posed questions, nonsensical models, or inappropriate estimators, they also frequently occur when information about the quantities of interest exists in the data, through the likelihood function. We explain the problem in some detail and lay out two preliminary proposals for ways of dealing with noninvertable Hessians without changing the question asked.
Replication data at the Harvard Dataverse: https://doi.org/10.7910/DVN/0LRZN6.
- Jeff Gill, Gary King. 2003. "Numerical Issues Involved in Inverting Hessian Matrices." In Numerical Issues in Statistical Computing for the Social Scientist, edited by Micah Altman and Michael P. McDonald, Pp. 143-76. Hoboken, NJ: John Wiley and Sons, Inc.
- Gary King. 1991. "On Political Methodology." Political Analysis, 2, Pp. 1–30.Article
+ Abstract
“Politimetrics” (Gurr 1972), “polimetrics” (Alker 1975), “politometrics” (Hilton 1976), “political arithmetic” (Petty [1672] 1971), “quantitative Political Science (QPS),” “governmetrics,” “posopolitics” (Papayanopoulos 1973), “political science statistics (Rai and Blydenburgh 1973), “political statistics” (Rice 1926). These are some of the names that scholars have used to describe the field we now call “political methodology.” The history of political methodology has been quite fragmented until recently, as reflected by this patchwork of names. The field has begun to coalesce during the past decade and we are developing persistent organizations, a growing body of scholarly literature, and an emerging consensus about important problems that need to be solved. I make one main point in this article: If political methodology is to play an important role in the future of political science, scholars will need to find ways of representing more interesting political contexts in quantitative analyses. This does not mean that scholars should just build more and more complicated statistical models. Instead, we need to represent more of the essence of political phenomena in our models. The advantage of formal and quantitative approaches is that they are abstract representations of the political world and are, thus, much clearer. We need methods that enable us to abstract the right parts of the phenomenon we are studying and exclude everything superfluous. Despite the fragmented history of quantitative political analysis, a version of this goal has been voiced frequently by both quantitative researchers and their critics (Sec. 2). However, while recognizing this shortcoming, earlier scholars were not in the position to rectify it, lacking the mathematical and statistical tools and, early on, the data. Since political methodologists have made great progress in these and other areas in recent years, I argue that we are now capable of realizing this goal. In section 3, I suggest specific approaches to this problem. Finally, in section 4, I provide two modern examples, ecological inference and models of spatial autocorrelation, to illustrate these points.
Replication data at the Harvard Dataverse: https://doi.org/10.7910/DVN/TTW7YI.
- Gary King. 1986. "How Not to Lie With Statistics: Avoiding Common Mistakes in Quantitative Political Science." American Journal of Political Science, 30, Pp. 666–687.Article
+ Abstract
This article identifies a set of serious theoretical mistakes appearing with troublingly high frequency throughout the quantitative political science literature. These mistakes are all based on faulty statistical theory or on erroneous statistical analysis. Through algebraic and interpretive proofs, some of the most commonly made mistakes are explicated and illustrated. The theoretical problem underlying each is highlighted, and suggested solutions are provided throughout. It is argued that closer attention to these problems and solutions will result in more reliable quantitative analyses and more useful theoretical contributions.

Evaluating Social Security Forecasts 🔗
The accuracy of U.S. Social Security Administration (SSA) demographic and financial forecasts is crucial for the solvency of its Trust Funds, government programs comprising greater than 50% of all federal government expenditures, industry decision making, and the evidence base of many scholarly articles.
- Konstantin Kashin, Gary King, Samir Soneji. 2016. "Scoring Social Security Proposals: Response from Kashin, King, and Soneji." Journal of Economic Perspectives, 30, 2, Pp. 245–248.Article DOI
+ Abstract
This is a response to Peter Diamond’s comment on a two paragraph passage in our article, Konstantin Kashin, Gary King, and Samir Soneji. 2015. “Systematic Bias and Nontransparency in US Social Security Administration Forecasts.” Journal of Economic Perspectives, 2, 29: 239-258. - Konstantin Kashin, Gary King, Samir Soneji. 2015. "Explaining Systematic Bias and Nontransparency in US Social Security Administration Forecasts." Political Analysis, 23, 3, Pp. 336–362.Article Publisher's Version
+ Abstract
The accuracy of U.S. Social Security Administration (SSA) demographic and financial forecasts is crucial for the solvency of its Trust Funds, government programs comprising greater than 50% of all federal government expenditures, industry decision making, and the evidence base of many scholarly articles. Forecasts are also essential for scoring policy proposals put forward by both political parties or anyone else. Because SSA makes public little replication information, and uses ad hoc, qualitative, and antiquated statistical forecasting methods, no one in or out of government has been able to produce fully independent alternative forecasts or policy scorings. Yet, no systematic evaluation of SSA forecasts has ever been published by SSA or anyone else. We show that SSA’s forecasting errors were approximately unbiased until about 2000, but then began to grow quickly, with increasingly overconfident uncertainty intervals. Moreover, the errors all turn out to be in the same potentially dangerous direction, each making the Social Security Trust Funds look healthier than they actually are. We also discover the cause of these findings with evidence from a large number of interviews we conducted with participants at every level of the forecasting and policy processes. We show that SSA’s forecasting procedures meet all the conditions the modern social-psychology and statistical literatures demonstrate make bias likely. When those conditions mixed with potent new political forces trying to change Social Security and influence the forecasts, SSA’s actuaries hunkered down trying hard to insulate themselves from the intense political pressures. Unfortunately, this otherwise laudable resistance to undue influence, along with their ad hoc qualitative forecasting models, led them to also miss important changes in the input data, such as retirees living longer lives, and drawing more benefits, than predicted by their simple extrapolations. We explain that solving this problem involves using (a) removing human judgment where possible, by using modern statistical methods – via the revolution in data science and big data; (b) instituting formal structural procedures when human judgment is required – via the revolution in social psychological research; and (c) requiring transparency and data sharing to catch errors that slip through – via the revolution in data sharing & replication. This talk is based on publications available at the Evaluating Social Security Forecasts project. - Konstantin Kashin, Gary King, Samir Soneji. 2015. "Systematic Bias and Nontransparency in US Social Security Administration Forecasts." Journal of Economic Perspectives, 29, 2, Pp. 239–258.Article Publisher's Version
+ Abstract
The financial stability of four of the five largest U.S. federal entitlement programs, strategic decision making in several industries, and many academic publications all depend on the accuracy of demographic and financial forecasts made by the Social Security Administration (SSA). Although the SSA has performed these forecasts since 1942, no systematic and comprehensive evaluation of their accuracy has ever been published by SSA or anyone else. The absence of a systematic evaluation of forecasts is a concern because the SSA relies on informal procedures that are potentially subject to inadvertent biases and does not share with the public, the scientific community, or other parts of SSA sufficient data or information necessary to replicate or improve its forecasts. These issues result in SSA holding a monopoly position in policy debates as the sole supplier of fully independent forecasts and evaluations of proposals to change Social Security. To assist with the forecasting evaluation problem, we collect all SSA forecasts for years that have passed and discover error patterns that could have been—and could now be—used to improve future forecasts. Specifically, we find that after 2000, SSA forecasting errors grew considerably larger and most of these errors made the Social Security Trust Funds look more financially secure than they actually were. In addition, SSA’s reported uncertainty intervals are overconfident and increasingly so after 2000. We discuss the implications of these systematic forecasting biases for public policy.
Replication data at the Harvard Dataverse: https://doi.org/10.7910/DVN/28122.
- Konstantin Kashin, Gary King, Samir Soneji. 2015. "Replication Data For: Explaining Systematic Bias and Nontransparency in U.S. Social Security Administration Forecasts.." doi:6:967llFHgiywsHWWp1cVg9A.
- Konstantin Kashin, Gary King, Samir Soneji. 2015. "Replication Data For: Systematic Bias and Nontransparency in U.S. Social Security Administration Forecasts.." doi:5:1oerGFXQ0Bu9bcMFU5/t2A.
- Samir Soneji, Gary King. 2012. "Statistical Security for Social Security." Demography, 49, 3, Pp. 1037–1060.Article Publisher's Version Replication Data Replication Data
+ Abstract
The financial viability of Social Security, the single largest U.S. Government program, depends on accurate forecasts of the solvency of its intergenerational trust fund. We begin by detailing information necessary for replicating the Social Security Administration’s (SSA’s) forecasting procedures, which until now has been unavailable in the public domain. We then offer a way to improve the quality of these procedures due to age-and sex-specific mortality forecasts. The most recent SSA mortality forecasts were based on the best available technology at the time, which was a combination of linear extrapolation and qualitative judgments. Unfortunately, linear extrapolation excludes known risk factors and is inconsistent with long-standing demographic patterns such as the smoothness of age profiles. Modern statistical methods typically outperform even the best qualitative judgments in these contexts. We show how to use such methods here, enabling researchers to forecast using far more information, such as the known risk factors of smoking and obesity and known demographic patterns. Including this extra information makes a sub¬stantial difference: For example, by only improving mortality forecasting methods, we predict three fewer years of net surplus, $730 billion less in Social Security trust funds, and program costs that are 0.66% greater of projected taxable payroll compared to SSA projections by 2031. More important than specific numerical estimates are the advantages of transparency, replicability, reduction of uncertainty, and what may be the resulting lower vulnerability to the politicization of program forecasts. In addition, by offering with this paper software and detailed replication information, we hope to marshal the efforts of the research community to include ever more informative inputs and to continue to reduce the uncertainties in Social Security forecasts.
This work builds on our article that provides forecasts of US Mortality rates (see King and Soneji, The Future of Death in America), a book developing improved methods for forecasting mortality (Girosi and King, Demographic Forecasting), all data we used (King and Soneji, replication data sets), and open source software that implements the methods (Girosi and King, YourCast). Also available is a New York Times Op-Ed based on this work (King and Soneji, Social Security: It’s Worse Than You Think), and a replication data set for the Op-Ed (King and Soneji, replication data set).
- Gary King, Samir Soneji. 2011. "The Future of Death in America." Demographic Research, 25, Pp. 1–38.Article DOI
+ Abstract
Population mortality forecasts are widely used for allocating public health expenditures, setting research priorities, and evaluating the viability of public pensions, private pensions, and health care financing systems. In part because existing methods seem to forecast worse when based on more information, most forecasts are still based on simple linear extrapolations that ignore known biological risk factors and other prior information. We adapt a Bayesian hierarchical forecasting model capable of including more known health and demographic information than has previously been possible. This leads to the first age- and sex-specific forecasts of American mortality that simultaneously incorporate, in a formal statistical model, the effects of the recent rapid increase in obesity, the steady decline in tobacco consumption, and the well known patterns of smooth mortality age profiles and time trends. Formally including new information in forecasts can matter a great deal. For example, we estimate an increase in male life expectancy at birth from 76.2 years in 2010 to 79.9 years in 2030, which is 1.8 years greater than the U.S. Social Security Administration projection and 1.5 years more than U.S. Census projection. For females, we estimate more modest gains in life expectancy at birth over the next twenty years from 80.5 years to 81.9 years, which is virtually identical to the Social Security Administration projection and 2.0 years less than U.S. Census projections. We show that these patterns are also likely to greatly affect the aging American population structure. We offer an easy-to-use approach so that researchers can include other sources of information and potentially improve on our forecasts too.
Replication data at the Harvard Dataverse: https://doi.org/10.7910/DVN/IEANXM.
- Federico Girosi, Gary King. 2008. "Demographic Forecasting." Princeton University Press, Princeton.Publisher's Site Errata Dataverse YourCast Software
+ Abstract
We introduce a new framework for forecasting age-sex-country-cause-specific mortality rates that incorporates considerably more information, and thus has the potential to forecast much better, than any existing approach. Mortality forecasts are used in a wide variety of academic fields, and for global and national health policy making, medical and pharmaceutical research, and social security and retirement planning. As it turns out, the tools we developed in pursuit of this goal also have broader statistical implications, in addition to their use for forecasting mortality or other variables with similar statistical properties. First, our methods make it possible to include different explanatory variables in a time series regression for each cross-section, while still borrowing strength from one regression to improve the estimation of all. Second, we show that many existing Bayesian (hierarchical and spatial) models with explanatory variables use prior densities that incorrectly formalize prior knowledge. Many demographers and public health researchers have fortuitously avoided this problem so prevalent in other fields by using prior knowledge only as an ex post check on empirical results, but this approach excludes considerable information from their models. We show how to incorporate this demographic knowledge into a model in a statistically appropriate way. Finally, we develop a set of tools useful for developing models with Bayesian priors in the presence of partial prior ignorance. This approach also provides many of the attractive features claimed by the empirical Bayes approach, but fully within the standard Bayesian theory of inference.
Chinese Censorship 🔗
We "reverse engineer" Chinese information controls -- the most extensive effort to selectively control human expression in the history of the world. We show that this massive effort to slow the flow of information paradoxically also conveys a great deal about the intentions, goals, and actions of the leaders.
- Gary King, Jennifer Pan, Margaret E. Roberts. 2017. "How the Chinese Government Fabricates Social Media Posts for Strategic Distraction, Not Engaged Argument." American Political Science Review, 111, 3, Pp. 484–501.Article Publisher's Version Appendix
+ Abstract
The Chinese government has long been suspected of hiring as many as 2,000,000 people to surreptitiously insert huge numbers of pseudonymous and other deceptive writings into the stream of real social media posts, as if they were the genuine opinions of ordinary people. Many academics, and most journalists and activists, claim that these so-called “50c party” posts vociferously argue for the government’s side in political and policy debates. As we show, this is also true of the vast majority of posts openly accused on social media of being 50c. Yet, almost no systematic empirical evidence exists for this claim, or, more importantly, for the Chinese regime’s strategic objective in pursuing this activity. In the first large scale empirical analysis of this operation, we show how to identify the secretive authors of these posts, the posts written by them, and their content. We estimate that the government fabricates and posts about 448 million social media comments a year. In contrast to prior claims, we show that the Chinese regime’s strategy is to avoid arguing with skeptics of the party and the government, and to not even discuss controversial issues. We show that the goal of this massive secretive operation is instead to distract the public and change the subject, as most of the these posts involve cheerleading for China, the revolutionary history of the Communist Party, or other symbols of the regime. We discuss how these results fit with what is known about the Chinese censorship program, and suggest how they may change our broader theoretical understanding of “common knowledge” and information control in authoritarian regimes.
This paper is related to our articles in Science, “Reverse-Engineering Censorship In China: Randomized Experimentation And Participant Observation”, and the American Political Science Review, “How Censorship In China Allows Government Criticism But Silences Collective Expression”.
Replication data at the Harvard Dataverse: https://doi.org/10.7910/DVN/QSZMPD.
- Gary King, Jennifer Pan, Margaret E. Roberts. 2014. "Reverse-Engineering Censorship in China: Randomized Experimentation and Participant Observation." Science, 345, 6199, Pp. 1251722.Article Publisher's Version Appendix
+ Abstract
Existing research on the extensive Chinese censorship organization uses observational methods with well-known limitations. We conducted the first large-scale experimental study of censorship by creating accounts on numerous social media sites, randomly submitting different texts, and observing from a worldwide network of computers which texts were censored and which were not. We also supplemented interviews with confidential sources by creating our own social media site, contracting with Chinese firms to install the same censoring technologies as existing sites, and—with their software, documentation, and even customer support—reverse-engineering how it all works. Our results offer rigorous support for the recent hypothesis that criticisms of the state, its leaders, and their policies are published, whereas posts about real-world events with collective action potential are censored.
Replication data at the Harvard Dataverse: https://doi.org/10.7910/DVN/26212.
- Gary King, Jennifer Pan, Margaret E. Roberts. 2013. "How Censorship in China Allows Government Criticism But Silences Collective Expression." American Political Science Review, 107, 2, Pp. 326–343.Article
+ Abstract
We offer the first large scale, multiple source analysis of the outcome of what may be the most extensive effort to selectively censor human expression ever implemented. To do this, we have devised a system to locate, download, and analyze the content of millions of social media posts originating from nearly 1,400 different social media services all over China before the Chinese government is able to find, evaluate, and censor (i.e., remove from the Internet) the large subset they deem objectionable. Using modern computer-assisted text analytic methods that we adapt to and validate in the Chinese language, we compare the substantive content of posts censored to those not censored over time in each of 85 topic areas. Contrary to previous understandings, posts with negative, even vitriolic, criticism of the state, its leaders, and its policies are not more likely to be censored. Instead, we show that the censorship program is aimed at curtailing collective action by silencing comments that represent, reinforce, or spur social mobilization, regardless of content. Censorship is oriented toward attempting to forestall collective activities that are occurring now or may occur in the future — and, as such, seem to clearly expose government intent.
Replication data at the Harvard Dataverse: https://doi.org/10.7910/DVN1/22691.
- Barry C. Burden, David C. Kimball, Gary King. 2002. "Archive of the Controversy Involving Wendy K. Tam Cho, Brian J. Gaines, and the American Political Science Review."
+ Abstract
An article by Barry C. Burden and David C. Kimball entitled “A New Approach to the Study of Ticket Splitting” was published in the September 1998 issue of the American Political Science Review. The empirical part of the article made use of an ecological inference technique developed by Gary King in his book, A Solution to the Ecological Inference Problem (Princeton University Press,1997). As the Burden-Kimball paper was going to press, Wendy K.Tam Cho and Brian J. Gaines submitted a critique of it to the APSR using data publicly archived by Burden and Kimball at the ICPSR. The Cho-Gaines paper criticized many aspects of the Burden-Kimball article, but focused primarily on the use of King’s ecological inference method. The Cho-Gaines paper survived the review process and was accepted for publication, at which point the APSR Editor, Ada Finifter, permitted Burden-Kimball and King to submit responses. These responses made use of replication datasets provided by Cho and Gaines (but not available to their reviewers) and went through the review process as well. Both papers discredited the Cho-Gaines critique, but the Burden-Kimball paper also revealed that Cho and Gaines had failed to replicate Burden and Kimball’s analysis as they had claimed. This led Finifter to pull the Cho-Gaines paper from the publication pipeline and publish none of the papers. The following statement was offered to Review readers:
“Because of inaccuracies discovered during the prepublication process, ‘Reassessing the Study of Split-Ticket Voting,’ by Wendy K. Tam Cho and Brian J. Gaines, previously listed as forthcoming, has been withdrawn from publication” (December 2001 APSR).
This archive contains the material necessary for those who wish to review the entire case. The 56 files provided here include the Cho-Gaines paper and the rebuttals by Burden-Kimball and King, replication datasets provided by Cho and Gaines, and a decision letter from Finifter.
See the README for an overview, my concluding comment, and the entire archive here, or at the Dataverse** and in the ICPSR Replication Archive.**
Incumbency Advantage 🔗
Proof that previously used estimators of electoral incumbency advantage were biased, and a new unbiased estimator. Also, the first systematic demonstration that constituency service by legislators increases the incumbency advantage.
How to Estimate the Electoral Advantage of Incumbency
- James Honaker, Gary King, Jonathan N. Katz. 2002. "A Fast, Easy, and Efficient Estimator for Multiparty Electoral Data." Political Analysis, 10, Pp. 84–100.Article
+ Abstract
Katz and King (1999) develop a model for predicting or explaining aggregate electoral results in multiparty democracies. This model is, in principle, analogous to what least squares regression provides American politics researchers in that two-party system. Katz and King applied this model to three-party elections in England and revealed a variety of new features of incumbency advantage and where each party pulls support from. Although the mathematics of their statistical model covers any number of political parties, it is computationally very demanding, and hence slow and numerically imprecise, with more than three. The original goal of our work was to produce an approximate method that works quicker in practice with many parties without making too many theoretical compromises. As it turns out, the method we offer here improves on Katz and King’s (in bias, variance, numerical stability, and computational speed) even when the latter is computationally feasible. We also offer easy-to-use software that implements our suggestions.
Replication data at the Harvard Dataverse: https://doi.org/10.7910/DVN/F06OSQ.
- Jonathan Katz, Gary King. 1999. "A Statistical Model for Multiparty Electoral Data." American Political Science Review, 93, Pp. 15–32.Article
+ Abstract
We propose a comprehensive statistical model for analyzing multiparty, district-level elections. This model, which provides a tool for comparative politics research analagous to that which regression analysis provides in the American two-party context, can be used to explain or predict how geographic distributions of electoral results depend upon economic conditions, neighborhood ethnic compositions, campaign spending, and other features of the election campaign or aggregate areas. We also provide new graphical representations for data exploration, model evaluation, and substantive interpretation. We illustrate the use of this model by attempting to resolve a controversy over the size of and trend in electoral advantage of incumbency in Britain. Contrary to previous analyses, all based on measures now known to be biased, we demonstrate that the advantage is small but meaningful, varies substantially across the parties, and is not growing. Finally, we show how to estimate the party from which each party’s advantage is predominantly drawn. Winner of the Pi Sigma Alpha Awardfor the best paper at the previous year’s meetings of the Midwest Political Science Association, 1998.
Replication data at the Harvard Dataverse: https://doi.org/10.7910/DVN/NDS9AT.
- Andrew Gelman, Gary King. 1990. "Estimating Incumbency Advantage Without Bias." American Journal of Political Science, 34, Pp. 1142–1164.Article
+ Abstract
In this paper we prove theoretically and demonstrate empirically that all existing measures of incumbency advantage in the congressional elections literature are biased or inconsistent. We then provide an unbiased estimator based on a very simple linear regression model. We apply this new method to congressional elections since 1900, providing the first evidence of a positive incumbency advantage in the first half of the century.
Causes and Consequences
- Danny Ebanks, Jonathan N. Katz, Gary King. 2025. "How American Politics Ensures Electoral Accountability in Congress."Article
+ Abstract
An essential component of democracy is the ability to hold legislators accountable via the threat of electoral defeat, a concept that has rarely been quantified directly. Well known massive changes over time in indirect measures — such as incumbency advantage, electoral margins, partisan bias, partisan advantage, split ticket voting, and others — all seem to imply wide swings in electoral accountability. In contrast, we show that the (precisely calibrated) probability of defeating incumbent US House members has been surprisingly constant and remarkably high for two-thirds of a century. We resolve this paradox with a generative statistical model, validated with extensive out-of-sample tests, that uses the full vote distribution to avoid biases induced by the common practice of studying only central tendencies. We show that different states of the partisan battlefield lead in interestingly different ways to the same high probability of incumbent defeat. Many challenges to American democracy remain, but this core feature remains durable.
Based on joint work with Danny Ebanks and Jonathan N. Katz. For more information, see GaryKing.org.
- Gary King. 1991. "Constituency Service and Incumbency Advantage." British Journal of Political Science, 21, Pp. 119–128.Article
+ Abstract
This Note addresses the long-standing discrepancy between scholarly support for the effect of constituency service on incumbency advantage and a large body of contradictory empirical evidence. I show first that many of the methodological problems noticed in past research reduce to a single methodological problem that is readily resolved. The core of this Note then provides among the first systematic empirical evidence for the constituency service hypothesis. Specifically, an extra $10,000 added to the budget of the average state legislator gives this incumbent an additional 1.54 percentage points in the next election (with a 95% confidence interval of 1.14 to 1.94 percentage points).
Replication data at the Harvard Dataverse: https://doi.org/10.7910/DVN/NKCJK6.
- Gary King, Andrew Gelman. 1991. "Systemic Consequences of Incumbency Advantage in the U.S. House." American Journal of Political Science, 35, Pp. 110–138.Article
+ Abstract
The dramatic increase in the electoral advantage of incumbency has sparked widespread interest among congressional researchers over the last 15 years. Although many scholars have studied the advantages of incumbency for incumbents, few have analyzed its effects on the underlying electoral system. We examine the influence of the incumbency advantage on two features of the electoral system in the U.S. House elections: electoral responsiveness and partisan bias. Using a district-level seats-votes model of House elections, we are able to distinguish systematic changes from unique, election-specific variations. Our results confirm the significant drop in responsiveness, and even steeper decline outside the South, over the past 40 years. Contrary to expectations, we find that increased incumbency advantage explains less than a third of this trend, indicating that some other unknown factor is responsible. Moreover, our analysis also reveals another dramatic pattern, largely overlooked in the congressional literature: in the 1940’s and 1950’s the electoral system was severely biased in favor of the Republican party. The system shifted incrementally from this severe Republican bias over the next several decades to a moderate Democratic bias by the mid-1980’s. Interestingly, changes in incumbency advantage explain virtually all of this trend in partisan bias since the 1940’s. By removing incumbency advantage and the existing configuration of incumbents and challengers analytically, our analysis reveals an underlying electoral system that remains consistently biased in favor of the Republican party. Thus, our results indicate that incumbency advantage affects the underlying electoral system, but contrary to conventional wisdom, this changes the trend in partisan bias more than electoral responsiveness. - Andrew Gelman, Gary King. 1989. "Electoral Responsiveness in U.S. Congressional Elections, 1946-1986." Proceedings of the Social Statistics Section, American Statistical Association, Pp. 208.
Data
- Gary King, Bradley Palmquist. 1998. "The Record of American Democracy, 1984-1990." Sociological Methods and Research, 26, Pp. 424–427.
Mexican Health Care Evaluation 🔗
An evaluation of the Mexican Seguro Popular program (designed to extend health insurance and regular and preventive medical care, pharmaceuticals, and health facilities to 50 million uninsured Mexicans), one of the world's largest health policy reforms of the last two decades. Our evaluation features a new design for field experiments that is more robust to the political interventions and implementation errors that have ruined many similar previous efforts; new statistical methods that produce more reliable and efficient results using fewer resources, assumptions, and data, as well as standard errors that are as much as 600% smaller; and an implementation of these methods in the largest randomized health policy experiment to date. (See the Harvard Gazette story on this project.)
- Kosuke Imai, Gary King, Carlos Velasco Rivera. 2020. "Do Nonpartisan Programmatic Policies Have Partisan Electoral Effects? Evidence from Two Large Scale Experiments." The Journal of Politics, 82, 2, Pp. 714–730.Article Publisher's Version Appendix
+ Abstract
A vast literature demonstrates that voters around the world who benefit from their governments’ discretionary spending cast more ballots for the incumbent party than those who do not benefit. But contrary to most theories of political accountability, some suggest that voters also reward incumbent parties for implementing “programmatic” spending legislation, over which incumbents have no discretion, and even when passed with support from all major parties. Why voters would attribute responsibility when none exists is unclear, as is why minority party legislators would approve of legislation that would cost them votes. We study the electoral effects of two large prominent programmatic policies that fit the ideal type especially well, with unusually large scale experiments that bring more evidence to bear on this question than has previously been possible. For the first policy, we design and implement ourselves one of the largest randomized social experiments ever. For the second policy, we reanalyze studies that used a large scale randomized experiment and a natural experiment to study the same question but came to opposite conclusions. Using corrected data and improved statistical methods, we show that the evidence from all analyses of both policies is consistent: programmatic policies have no effect on voter support for incumbents. We conclude by discussing how the many other studies in the literature may be interpreted in light of our results. - Katherine Semrau, Lisa R. Hirschhorn, Bhala Kodkany, Jonathan Spector, Danielle E. Tuller, Gary King, Stuart Lisptiz, Narender Sharma, Vinay P. Singh, Bharath Kumar, Neelam Dhingra-Kumar, Rebecca Firestone, Vishwajeet Kumar, Atul Gawande. 2016. "Effectiveness of the WHO Safe Childbirth Checklist Program in Reducing Severe Maternal, Fetal, and Newborn Harm: Study Protocol for a Matched-Pair, Cluster Randomized Controlled Trial in Uttar Pradesh, India." Trials, 17, 1, Pp. 576.Article Publisher's Version Appendix
+ Abstract
Background: Effective, scalable strategies to improve maternal, fetal, and newborn health and reduce preventable morbidity and mortality are urgently needed in low- and middle-income countries. Building on the successes of previous checklist-based programs, the World Health Organization (WHO) and partners led the development of the Safe Childbirth Checklist (SCC), a 28-item list of evidence-based practices linked with improved maternal and newborn outcomes. Pilot-testing of the Checklist in Southern India demonstrated dramatic improvements in adherence by health workers to essential childbirth-related practices (EBPs). The BetterBirth Trial seeks to measure the effectiveness of SCC impact on EBPs, deaths, and complications at a larger scale.
Methods: This matched-pair, cluster-randomized controlled, adaptive trial will be conducted in 120 facilities across 24 districts in Uttar Pradesh, India. Study sites, identified according to predefined eligibility criteria, were matched by measured covariates before randomization. The intervention, the SCC embedded in a quality improvement program, consists of leadership engagement, a 2-day educational launch of the SCC, and support through placement of a trained peer “coach” to provide supportive supervision and real-time data feedback over an 8-month period with decreasing intensity. A facility-based childbirth quality coordinator is trained and supported to drive sustained behavior change after the BetterBirth team leaves the facility. Study participants are birth attendants and women and their newborns who present to the study facilities for childbirth at 60 intervention and 60 control sites. The primary outcome is a composite measure including maternal death, maternal severe morbidity, stillbirth, and newborn death, occurring within 7 days after birth. The sample size (n = 171,964) was calculated to detect a 15% reduction in the primary outcome. Adherence by health workers to EBPs will be measured in a subset of births (n = 6000). The trial will be conducted in close collaboration with key partners including the Governments of India and Uttar Pradesh, the World Health Organization, an expert Scientific Advisory Committee, an experienced local implementing organization (Population Services International, PSI), and frontline facility leaders and workers
Discussion: If effective, the WHO Safe Childbirth Checklist program could be a powerful health facilitystrengthening intervention to improve quality of care and reduce preventable harm to women and newborns, with millions of potential beneficiaries.
Trial registration: BetterBirth Study Protocol dated: 13 February 2014; ClinicalTrials.gov: NCT02148952; Universal Trial Number: U1111-1131-5647.
- Kosuke Imai, Gary King, Clayton Nall. 2009. "Matched Pairs and the Future of Cluster-Randomized Experiments: A Rejoinder." Statistical Science, 24, Pp. 64–72.Article
+ Abstract
A basic feature of many field experiments is that investigators are only able to randomize clusters of individuals–-such as households, communities, firms, medical practices, schools, or classrooms–-even when the individual is the unit of interest. To recoup the resulting efficiency loss, some studies pair similar clusters and randomize treatment within pairs. However, many other studies avoid pairing, in part because of claims in the literature, echoed by clinical trials standards organizations, that this matched-pair, cluster-randomization design has serious problems. We argue that all such claims are unfounded. We also prove that the estimator recommended for this design in the literature is unbiased only in situations when matching is unnecessary and and its standard error is also invalid. To overcome this problem without modeling assumptions, we develop a simple design-based estimator with much improved statistical properties. We also propose a model-based approach that includes some of the benefits of our design-based estimator as well as the estimator in the literature. Our methods also address individual-level noncompliance, which is common in applications but not allowed for in most existing methods. We show that from the perspective of bias, efficiency, power, robustness, or research costs, and in large or small samples, pairing should be used in cluster-randomized experiments whenever feasible and failing to do so is equivalent to discarding a considerable fraction of one’s data. We develop these techniques in the context of a randomized evaluation we are conducting of the Mexican Universal Health Insurance Program. - Gary King, Emmanuela Gakidou, Kosuke Imai, Jason Lakin, Ryan T. Moore, Clayton Nall, Nirmala Ravishankar, Manett Vargas, Martha María Téllez-Rojo, Juan Eugenio Hernández Ávila, Mauricio Hernández Ávila, Héctor Hernández Llamas. 2009. "Public Policy for the Poor? A Randomised Assessment of the Mexican Universal Health Insurance Programme." The Lancet, 373, Pp. 1447-54.Article
+ Abstract
Background:We assessed aspects of Seguro Popular, a programme aimed to deliver health insurance, regular and preventive medical care, medicines, and health facilities to 50 million uninsured Mexicans. Methods:We randomly assigned treatment within 74 matched pairs of health clusters–-i.e., health facility catchment areas–-representing 118,569 households in seven Mexican states, and measured outcomes in a 2005 baseline survey (August 2005, to September 2005) and follow-up survey 10 months later (July 2006, to August 2006) in 50 pairs (n=32 515). The treatment consisted of encouragement to enrol in a health-insurance programme and upgraded medical facilities. Participant states also received funds to improve health facilities and to provide medications for services in treated clusters. We estimated intention to treat and complier average causal effects non-parametrically. Findings:Intention-to-treat estimates indicated a 23% reduction from baseline in catastrophic expenditures (1·9% points and 95% CI 0·14-3·66). The effect in poor households was 3·0% points (0·46-5·54) and in experimental compliers was 6·5% points (1·65-11·28), 30% and 59% reductions, respectively. The intention-to-treat effect on health spending in poor households was 426 pesos (39-812), and the complier average causal effect was 915 pesos (147-1684). Contrary to expectations and previous observational research, we found no effects on medication spending, health outcomes, or utilisation. Interpretation:Programme resources reached the poor. However, the programme did not show some other effects, possibly due to the short duration of treatment (10 months). Although Seguro Popular seems to be successful at this early stage, further experiments and follow-up studies, with longer assessment periods, are needed to ascertain the long-term effects of the programme.
Replication data at the Harvard Dataverse: https://doi.org/10.7910/DVN/P6NC0M.
- Gary King, Emmanuela Gakidou, Kosuke Imai, Jason Lakin, Ryan Moore, Clayton Nall, Nirmala Ravishankar, Manett Vargas, Martha María Téllez-Rojo, Juan Eugenio Hernández Ávila, Mauricio Hernández Ávila, Héctor Hernández Llamas. 2009. "Replication Data For: Public Policy for the Poor? A Randomised Assessment of the Mexican Universal Health Insurance Programme."
- Kosuke Imai, Gary King, Clayton Nall. 2009. "The Essential Role of Pair Matching in Cluster-Randomized Experiments, With Application to the Mexican Universal Health Insurance Evaluation." Statistical Science, 24, 1, Pp. 29–53.Article
+ Abstract
A basic feature of many field experiments is that investigators are only able to randomize clusters of individuals–-such as households, communities, firms, medical practices, schools, or classrooms–-even when the individual is the unit of interest. To recoup the resulting efficiency loss, some studies pair similar clusters and randomize treatment within pairs. However, many other studies avoid pairing, in part because of claims in the literature, echoed by clinical trials standards organizations, that this matched-pair, cluster-randomization design has serious problems. We argue that all such claims are unfounded. We also prove that the estimator recommended for this design in the literature is unbiased only in situations when matching is unnecessary and and its standard error is also invalid. To overcome this problem without modeling assumptions, we develop a simple design-based estimator with much improved statistical properties. We also propose a model-based approach that includes some of the benefits of our design-based estimator as well as the estimator in the literature. Our methods also address individual-level noncompliance, which is common in applications but not allowed for in most existing methods. We show that from the perspective of bias, efficiency, power, robustness, or research costs, and in large or small samples, pairing should be used in cluster-randomized experiments whenever feasible and failing to do so is equivalent to discarding a considerable fraction of one’s data. We develop these techniques in the context of a randomized evaluation we are conducting of the Mexican Universal Health Insurance Program.
Replication data at the Harvard Dataverse: https://doi.org/10.7910/DVN/9RJGWB.
- Gary King, Emmanuela Gakidou, Nirmala Ravishankar, Ryan Moore, Jason Lakin, Manett Vargas, Martha María Téllez-Rojo, Juan Eugenio Hernández Ávila, Mauricio Hernández Ávila, Héctor Hernández Llamas. 2007. "A 'Politically Robust' Experimental Design for Public Policy Evaluation, With Application to the Mexican Universal Health Insurance Program." Journal of Policy Analysis and Management, 26, Pp. 479-506.Article
+ Abstract
We develop an approach to conducting large scale randomized public policy experiments intended to be more robust to the political interventions that have ruined some or all parts of many similar previous efforts. Our proposed design is insulated from selection bias in some circumstances even if we lose observations and our inferences can still be unbiased even if politics disrupts any two of the three steps in our analytical procedures and and other empirical checks are available to validate the overall design. We illustrate with a design and empirical validation of an evaluation of the Mexican Seguro Popular de Salud (Universal Health Insurance) program we are conducting. Seguro Popular, which is intended to grow to provide medical care, drugs, preventative services, and financial health protection to the 50 million Mexicans without health insurance, is one of the largest health reforms of any country in the last two decades. The evaluation is also large scale, constituting one of the largest policy experiments to date and what may be the largest randomized health policy experiment ever.
Presidency Research; Voting Behavior 🔗
Resolution of the paradox of why polls are so variable over time during presidential campaigns even though the vote outcome is easily predictable before it starts. Also, a resolution of a key controversy over absentee ballots during the 2000 presidential election; and the methodology of small-n research on executives.
Methods
- Gary King. 2020. "Expert Report of Gary King, in Bowyer et Al. V. Ducey (Governor) et Al., US District Court, District of Arizona."Article
+ Abstract
In this report, I evaluate evidence described and conclusions drawn in several Exhibits in this case offered by the Plaintiffs. I conclude that the evidence is insufficient to support conclusions about election fraud. Throughout, the authors break the chain of evidence repeatedly – from the 2020 election, to the data analyzed, to the quantitative results presented, to the conclusions drawn – and as such cannot be relied on. In addition, the Exhibits make many crucial assumptions without justification, discussion, or even recognition – each of which can lead to substantial bias, and which was unrecognized and uncorrected. The data analytic and statistical procedures used in the Exhibits for data providence, data analysis, replication information, and statistical analysis all violate professional standards and should be disregarded. [Thanks to Soubhik Barari for research assistance.]
Update: Findings and conclusions of the expert witness report were confirmed in the Court’s ruling in this case: “Not only have Plaintiffs failed to provide the Court with factual support for their extraordinary claims, but they have wholly failed to establish that they have standing for the Court to consider them. Allegations that find favor in the public sphere of gossip and innuendo cannot be a substitute for earnest pleadings and procedure in federal court. They most certainly cannot be the basis for upending Arizona’s 2020 General Election. The Court is left with no alternative but to dismiss this matter in its entirety.”
- Gary King, Benjamin Schneer, Ariel White. 2017. "How the News Media Activate Public Expression and Influence National Agendas." Science, 358, Pp. 776-80.Article Publisher's Version Appendix
+ Abstract
We demonstrate that exposure to the news media causes Americans to take public stands on specific issues, join national policy conversations, and express themselves publicly—all key components of democratic politics—more often than they would otherwise. After recruiting 48 mostly small media outlets, we chose groups of these outlets to write and publish articles on subjects we approved, on dates we randomly assigned. We estimated the causal effect on proximal measures, such as website pageviews and Twitter discussion of the articles’ specific subjects, and distal ones, such as national Twitter conversation in broad policy areas. Our intervention increased discussion in each broad policy area by approximately 62.7% (relative to a day’s volume), accounting for 13,166 additional posts over the treatment week, with similar effects across population subgroups.
On the Science website: Abstract, Reprint, Full text, and a comment (by Matthew Gentzkow) “Small media, big impact”.
Replication data at the Harvard Dataverse: https://doi.org/10.7910/DVN/1EMHTK.
- Gerald Benjamin, Gary King. 1984. "The Stability of Party Identification Among U.S. Representatives: Political Loyalty, 1789-1984."Article
+ Abstract
This paper describes, explains, and predicts the practice of party switching among members of the U.S. House of Representatives.
The data for this study is available in my dataverse.
Voting Behavior
- Kosuke Imai, Gary King, Carlos Velasco Rivera. 2020. "Do Nonpartisan Programmatic Policies Have Partisan Electoral Effects? Evidence from Two Large Scale Experiments." The Journal of Politics, 82, 2, Pp. 714–730.Article Publisher's Version Appendix
+ Abstract
A vast literature demonstrates that voters around the world who benefit from their governments’ discretionary spending cast more ballots for the incumbent party than those who do not benefit. But contrary to most theories of political accountability, some suggest that voters also reward incumbent parties for implementing “programmatic” spending legislation, over which incumbents have no discretion, and even when passed with support from all major parties. Why voters would attribute responsibility when none exists is unclear, as is why minority party legislators would approve of legislation that would cost them votes. We study the electoral effects of two large prominent programmatic policies that fit the ideal type especially well, with unusually large scale experiments that bring more evidence to bear on this question than has previously been possible. For the first policy, we design and implement ourselves one of the largest randomized social experiments ever. For the second policy, we reanalyze studies that used a large scale randomized experiment and a natural experiment to study the same question but came to opposite conclusions. Using corrected data and improved statistical methods, we show that the evidence from all analyses of both policies is consistent: programmatic policies have no effect on voter support for incumbents. We conclude by discussing how the many other studies in the literature may be interpreted in light of our results. - Thomas, Andrew Gelman, Gary King, Jonathan Katz. 2012. "Estimating Partisan Bias of the Electoral College Under Proposed Changes in Elector Apportionment." Statistics, Politics and Policy, 4, 1, Pp. 1–13.Article Publisher's Version
+ Abstract
In the election for President of the United States, the Electoral College is the body whose members vote to elect the President directly. Each state sends a number of delegates equal to its total number of representatives and senators in Congress; all but two states (Nebraska and Maine) assign electors pledged to the candidate that wins the state’s plurality vote. We investigate the effect on presidential elections if states were to assign their electoral votes according to results in each congressional district,and conclude that the direct popular vote and the current electoral college are both substantially fairer compared to those alternatives where states would have divided their electoral votes by congressional district. - Gary King, Ori Rosen, Martin Tanner, Alexander Wagner. 2008. "Ordinary Economic Voting Behavior in the Extraordinary Election of Adolf Hitler." Journal of Economic History, 68, 4, Pp. 996.Article
+ Abstract
The enormous Nazi voting literature rarely builds on modern statistical or economic research. By adding these approaches, we find that the most widely accepted existing theories of this era cannot distinguish the Weimar elections from almost any others in any country. Via a retrospective voting account, we show that voters most hurt by the depression, and most likely to oppose the government, fall into separate groups with divergent interests. This explains why some turned to the Nazis and others turned away. The consequences of Hitler’s election were extraordinary, but the voting behavior that led to it was not.
Replication data at the Harvard Dataverse: https://doi.org/10.7910/DVN/OMYW0P.
- Kosuke Imai, Gary King. 2004. "Did Illegal Overseas Absentee Ballots Decide the 2000 U.S. Presidential Election?." Perspectives on Politics, 2, Pp. 537–549.Article
+ Abstract
Although not widely known until much later, Al Gore received 202 more votes than George W. Bush on election day in Florida. George W. Bush is president because he overcame his election day deficit with overseas absentee ballots that arrived and were counted after election day. In the final official tally, Bush received 537 more votes than Gore. These numbers are taken from the official results released by the Florida Secretary of State’s office and so do not reflect overvotes, undervotes, unsuccessful litigation, butterfly ballot problems, recounts that might have been allowed but were not, or any other hypothetical divergence between voter preferences and counted votes. After the election, the New York Timesconducted a six month long investigation and found that 680 of the overseas absentee ballots were illegally counted, and no partisan, pundit, or academic has publicly disagreed with their assessment. In this paper, we describe the statistical procedures we developed and implemented for the Timesto ascertain whether disqualifying these 680 ballots would have changed the outcome of the election. The methods involve adding formal Bayesian model averaging procedures to King’s (1997) ecological inference model. Formal Bayesian model averaging has not been used in political science but is especially useful when substantive conclusions depend heavily on apparently minor but indefensible model choices, when model generalization is not feasible, and when potential critics are more partisan than academic. We show how we derived the results for the Timesso that other scholars can use these methods to make ecological inferences for other purposes. We also present a variety of new empirical results that delineate the precise conditions under which Al Gore would have been elected president, and offer new evidence of the striking effectiveness of the Republican effort to convince local election officials to count invalid ballots in Bush counties and not count them in Gore counties. - Jeffrey Lewis, Gary King. 1999. "No Evidence on Directional Vs. Proximity Voting." Political Analysis, 8, Pp. 21–33.Article
+ Abstract
The directional and proximity models offer dramatically different theories for how voters make decisions and fundamentally divergent views of the supposed microfoundations on which vast bodies of literature in theoretical rational choice and empirical political behavior have been built. We demonstrate here that the empirical tests in the large and growing body of literature on this subject amount to theoretical debates about which statistical assumption is right. The key statistical assumptions have not been empirically tested and, indeed, turn out to be effectively untestable with exiting methods and data. Unfortunately, these assumptions are also crucial since changing them leads to different conclusions about voter processes.
Replication data at the Harvard Dataverse: https://doi.org/10.7910/DVN/TS0UJQ.
- Andrew Gelman, Gary King, John Boscardin. 1998. "Estimating the Probability of Events That Have Never Occurred: When Is Your Vote Decisive?." Journal of the American Statistical Association, 93, Pp. 1–9.Article
+ Abstract
Researchers sometimes argue that statisticians have little to contribute when few realizations of the process being estimated are observed. We show that this argument is incorrect even in the extreme situation of estimating the probabilities of events so rare that they have never occurred. We show how statistical forecasting models allow us to use empirical data to improve inferences about the probabilities of these events. Our application is estimating the probability that your vote will be decisive in a U.S. presidential election, a problem that has been studied by political scientists for more than two decades. The exact value of this probability is of only minor interest, but the number has important implications for understanding the optimal allocation of campaign resources, whether states and voter groups receive their fair share of attention from prospective presidents, and how formal “rational choice” models of voter behavior might be able to explain why people vote at all. We show how the probability of a decisive vote can be estimated empirically from state-level forecasts of the presidential election and illustrate with the example of 1992. Based on generalizations of standard political science forecasting models, we estimate the (prospective) probability of a single vote being decisive as about 1 in 10 million for close national elections such as 1992, varying by about a factor of 10 among states. Our results support the argument that subjective probabilities of many types are best obtained through empirically based statistical prediction models rather than solely through mathematical reasoning. We discuss the implications of our findings for the types of decision analyses used in public choice studies.
Replication data at the Harvard Dataverse: https://doi.org/10.7910/DVN/0FT6ZL.
- Andrew Gelman, Gary King, Sandy Maisel. 1994. "Party Competition and Media Messages in U.S. Presidential Election Campaigns." In The Parties Respond: Changes in the American Party System, Pp. 255-95. Boulder, Colorado: Westview Press.Book Chapter
+ Abstract
At one point during the 1988 campaign, Michael Dukakis was ahead in the public opinion polls by 17 percentage points, but he eventually lost the election by 8 percent. Walter Mondale was ahead in the polls by 4 percent during the 1984 campaign but lost the election in a landslide. During June and July of 1992, Clinton, Bush, and Perot each had turns in the public opinion poll lead. What explains all this poll variation? Why do so many citizens change their minds so quickly about presidential choices? - Gary King, Michael Laver. 1993. "On Party Platforms, Mandates, and Government Spending." American Political Science Review, 87, Pp. 744–750.Article
+ Abstract
In their 1990 Review article, Ian Budge and Richard Hofferbert analyzed the relationship between party platform emphases, control of the White House, and national government spending priorities, reporting strong evidence of a “party mandate” connection between them. Gary King and Michael Laver successfully replicate the original analysis, critique the interpretation of the causal effects, and present a reanalysis showing that platforms have small or nonexistent effects on spending. In response, Budge, Hofferbert, and Michael McDonald agree that their language was somewhat inconsistent on both interactions and causality but defend their conceptualization of “mandates” as involving only an association, not necessarily a causal connection, between party commitments and government policy. Hence, while the causes of government policy are of interest, noncausal associations are sufficient as evidence of party mandates in American politics.
Replication data at the Harvard Dataverse: https://doi.org/10.7910/DVN/KGMQBX.
- Andrew Gelman, Gary King. 1993. "Why Are American Presidential Election Campaign Polls so Variable When Votes Are so Predictable?." British Journal of Political Science, 23, Pp. 409–451.Article
+ Abstract
As most political scientists know, the outcome of the U.S. Presidential election can be predicted within a few percentage points (in the popular vote), based on information available months before the election. Thus, the general election campaign for president seems irrelevant to the outcome (except in very close elections), despite all the media coverage of campaign strategy. However, it is also well known that the pre-election opinion polls can vary wildly over the campaign, and this variation is generally attributed to events in the campaign. How can campaign events affect people’s opinions on whom they plan to vote for, and yet not affect the outcome of the election? For that matter, why do voters consistently increase their support for a candidate during his nominating convention, even though the conventions are almost entirely predictable events whose effects can be rationally forecast? In this exploratory study, we consider several intuitively appealing, but ultimately wrong, resolutions to this puzzle, and discuss our current understanding of what causes opinion polls to fluctuate and yet reach a predictable outcome. Our evidence is based on graphical presentation and analysis of over 67,000 individual-level responses from forty-nine commercial polls during the 1988 campaign and many other aggregate poll results from the 1952–1992 campaigns. We show that responses to pollsters during the campaign are not generally informed or even, in a sense we describe, “rational.” In contrast, voters decide which candidate to eventually support based on their enlightened preferences, as formed by the information they have learned during the campaign, as well as basic political cues such as ideology and party identification. We cannot prove this conclusion, but we do show that it is consistent with the aggregate forecasts and individual-level opinion poll responses. Based on the enlightened preferences hypothesis, we conclude that the news media have an important effect on the outcome of Presidential elections–-not due to misleading advertisements, sound bites, or spin doctors, but rather by conveying candidates’ positions on important issues. Winner of the Pi Sigma Alpha Awardfor the best paper at the previous year’s meetings of the Midwest Political Science Association.
Replication data at the Harvard Dataverse: https://doi.org/10.7910/DVN/I7GIKD.
- Gary King, Richard Merelman. 1986. "The Development of Political Activists: A Model of Early Learning." Social Science Quarterly, 67, Pp. 473–490.
+ Abstract
An analysis of panel data reveals the unique importance of early learning to the development of political activism among Americans. A combination of two learning models– the frequently used crystallization model and the rarely analyzed sensitization model– is advanced as most appropriate for understanding political socialization and the development of political activism. The findings contribute to research on elite behavior and on the process of political socialization. - Gary King. 1986. "The Significance of Roll Calls in Voting Bodies: A Model and Statistical Estimation." Social Science Research, 15, Pp. 135–152.
+ Abstract
In the long history of legislative roll call analyses, there continues to exist a particularly troubling problem: There is no satisfactory method for measuring the relative importance or significance of individual roll calls. A measure of roll call significance would be interesting in and of itself, but many have realized that it could also substantially improve empirical research. The consequence of this situation is that hundreds of researchers risk heteroskedastic disturbances (resulting in inefficient estimates and biased standard errors and test statistics), are unable to appropriately choose the roll calls most suited to their theory (resulting in analyses that may not correctly test their theory), and often use methods that create more problems than they solve (resulting in selection bias, unrealistic weighting schemes, or relatively subjective measures). This article introduces a new method designed to meet these problems. Based on an application of Box-Tiao intervention analysis, the method extracts from observed voting participation scores the “revealed preferences” of legislators as a measure of roll call significance. Applying this method to roll calls from the U.S. Senate demonstrates the success of the method and suggests its utility in applied research. - Gary King. 1985. "Book Review of `Forecasting Presidential Elections'." American Political Science Review, 79, 3, Pp. 855.Article
+ Abstract
This is a book review of Steven J. Rosenstone, Forecasting Presidential Elections, New Haven: Yale University Press, 1983. - Gerald Benjamin, Gary King. 1979. "The City's Losing Clout." New York Times, CXXVIII , 44,269 , Pp. A17.Article Publisher's Version
+ Abstract
New York City is a modern “rotten borough,” not because of population decline, but because of its massive and continuing fall-off in voter participation. New York City’s political base is more apparent than real.
Presidency Research
- Gary King, Michael Laver. 1999. "Many Publications, But Still No Evidence." Electoral Studies, 18, Pp. 597–598.Article
+ Abstract
In 1990, Budge and Hofferbert (B&H) claimed that they had found solid evidence that party platforms cause U.S. budgetary priorities, and thus concluded that mandate theory applies in the United States as strongly as it does elsewhere. The implications of this stunning conclusion would mean that virtually every observer of the American party system in this century has been wrong. King and Laver (1993) reanalyzed B&H’s data and demonstrated in two ways that there exists no evidence for a causal relationship. First, accepting their entire statistical model, and correcting only an algebraic error (a mistake in how they computed their standard errors), we showed that their hypothesized relationship holds up in fewer than half the tests they reported. Second, we showed that their statistical model includes a slightly hidden but politically implausible assumption that a new party achieves every budgetary desire immediately upon taking office. We then specified a model without this unrealistic assumption and we found that the assumption was not supported, and that all evidence in the data for platforms causing government budgets evaporated. In their published response to our article, B&H withdrew their key claim and said they were now (in 1993) merely interested in an association and not causation. That is how it was left in 1993—a perfectly amicable resolution as far as we were concerned—since we have no objection to the claim that there is a non-causal or chance association between any two variables. Of course, we see little reason to be interested in non-causal associations in this area any more than in the chance correlation that exists between the winner of the baseball World Series and the party winning the U.S. presidency. Since party mandate theory only makes sense as a causal theory, the conventional wisdom about America’s porous, non-mandate party system stands. - Gary King. 1993. "The Methodology of Presidential Research." In Researching the Presidency: Vital Questions, New Approaches, edited by George Edwards III, Bert A. Rockman, and John H. Kessel, Pp. 387–412. Pittsburgh: University of Pittsburgh.Book Chapter
+ Abstract
The original purpose of the paper this chapter was based on was to use the Presidency Research Conference’s first-round papers– by John H. Aldrich, Erwin C. Hargrove, Karen M. Hult, Paul Light, and Richard Rose– as my “data.” My given task was to analyze the literature ably reviewed by these authors and report what political methodology might have to say about presidency research. I focus in this chapter on the traditional presidency literature, emphasizing research on the president and the office. For the most part, I do not consider research on presidential selection, election, and voting behavior, which has been much more similar to other fields in American politics. - Paul Brace, Christine Harrington, Gary King. 1989. "The Presidency in American Politics." New York University Press, New York.Open Library
+ Abstract
“The modern American presidency is at once the most visible and most hidden of our political institutions. On any given day, the activities and duties of the President of the United States are known almost instantly throughout the nation, indeed, throughout the world. But why he and his colleagues in the Executive branch do what they do, how they do it, and the ways in which the public perception of their activities are formed, are all aspects of the presidency that remain elusive.
The Presidency in American Politics brings together the research of nine distinguished American political scientists, taking a broad view of presidential power and politics, and in some cases going beyond traditional approaches to the study of political phenomena. Among the specific aspects of the presidency examined are the organization of the White House staff; the President’s use of appointive power to shape the judiciary; the weight of presidential authority in our tripartite system; the changes in the process by which the parties select presidential nominees; how presidents present themselves; and the impact of electoral considerations on the President’s economic policy decisions.
New York University President John Brademas states in his introduction: “As the forty-first president has just assumed office, this is a fitting time to reflect anew on the challenges and opportunities that face him. I trust this volume will find an audience not only in college classrooms but in the Oval Office and on Capital Hill as well.””
- Gary King, Lyn Ragsdale. 1988. "The Elusive Executive: Discovering Statistical Patterns in the Presidency." CQ Press, Washington, DC.Open Library
+ Abstract
“The Elusive Executive: Discovering Statistical Patterns in the Presidency” is a foundational 1988 political science book by Gary King and Lyn Ragsdale. It systematically analyzes the U.S. presidency using quantitative data, exploring how institutional structures and environments shape presidential behavior and public policy. The work is highly regarded among political scientists for addressing how the presidency functions as a complex institution, moving past traditional biographical studies into rigorous, data-backed analysis." - Gary King. 1986. "Political Parties and Foreign Policy: A Structuralist Approach." Political Psychology, 7, Pp. 83–101.
+ Abstract
This article introduces the theory and approach of structural anthropology and applies it to a problem in American political science. Through this approach, the “bipartisan foreign policy hypothesis” and that “two presidencies hypothesis” are reformulated and reconsidered. Until now participants in the debate over each have only rarely built on, or even cited, the other’s research. An additional problem is that the widespread conventional wisdom in support of the two hypotheses is inconsistent with systematic scholarly analyses. This paper demonstrates that the two hypotheses are drawn from the same underlying structure. Each hypothesis and the theoretical model it implies is conceptually and empirically extended to take into account the differences between congressional leaders and members. Then, historical examples and statistical analyses of House roll call data are used to demonstrate that the hypotheses, while sometimes supported for the congressional members, are far more applicable to leadership decision making. Conclusions suggest that conventional wisdom be revised to take these differences into account.
Informatics and Data Sharing 🔗
Replication Standards New standards, protocols, and software for citing, sharing, analyzing, archiving, preserving, distributing, cataloging, translating, disseminating, naming, verifying, and replicating scholarly research data and analyses. Also includes proposals to improve the norms of data sharing and replication in science.
Informatics and Data Sharing
- Rockli Kim, Avleen S. Bijral, Yun Xu, Xiuyuan Zhang, Jeffrey C. Blossom, Akshay Swaminathan, Gary King, Alok Kumar, Rakesh Sarwal, Juan M. Lavista Ferres, S.V. Subramanian. 2021. "Precision Mapping Child Undernutrition for Nearly 600,000 Inhabited Census Villages in India." Proceedings of the National Academy of Sciences, 118, 18, Pp. e2025865118.Article Publisher's Version
+ Abstract
There are emerging opportunities to assess health indicators at truly small areas with increasing availability of data geocoded to micro geographic units and advanced modeling techniques. The utility of such fine-grained data can be fully leveraged if linked to local governance units that are accountable for implementation of programs and interventions. We used data from the 2011 Indian Census for village-level demographic and amenities features and the 2016 Indian Demographic and Health Survey in a bias-corrected semisupervised regression framework to predict child anthropometric failures for all villages in India. Of the total geographic variation in predicted child anthropometric failure estimates, 54.2 to 72.3% were attributed to the village level followed by 20.6 to 39.5% to the state level. The mean predicted stunting was 37.9% (SD: 10.1%; IQR: 31.2 to 44.7%), and substantial variation was found across villages ranging from less than 5% for 691 villages to over 70% in 453 villages. Estimates at the village level can potentially shift the paradigm of policy discussion in India by enabling more informed prioritization and precise targeting. The proposed methodology can be adapted and applied to diverse population health indicators, and in other contexts, to reveal spatial heterogeneity at a finer geographic scale and identify local areas with the greatest needs and with direct implications for actions to take place. - Gary King, Nathaniel Persily. 2019. "A New Model for Industry-Academic Partnerships." PS: Political Science & Politics, 53, 4, Pp. 703–709.Article Publisher's Version
+ Abstract
The mission of the social sciences is to understand and ameliorate society’s greatest challenges. The data held by private companies, collected for different purposes, hold vast potential to further this mission. Yet, because of consumer privacy, trade secrets, proprietary content, and political sensitivities, these datasets are often inaccessible to scholars. We propose a novel organizational model to address these problems. We also report on the first partnership under this model, to study the incendiary issues surrounding the impact of social media on elections and democracy: Facebook provides (privacy-preserving) data access; eight ideologically and substantively diverse charitable foundations provide funding; an organization of academics we created, Social Science One (see SocialScience.One), leads the project; and the Institute for Quantitative Social Science at Harvard and the Social Science Research Council provide logistical help. - Gary King. 2016. "Preface: Big Data Is Not About the Data!." In Computational Social Science: Discovery and Prediction, edited by R. Michael Alvarez. Cambridge: Cambridge University Press.Book Chapter
+ Abstract
A few years ago, explaining what you did for a living to Dad, Aunt Rose, or your friend from high school was pretty complicated. Answering that you develop statistical estimators, work on numerical optimization, or, even better, are working on a great new Markov Chain Monte Carlo implementation of a Bayesian model with heteroskedastic errors for automated text analysis is pretty much the definition of conversation stopper.
Then the media noticed the revolution we’re all apart of, and they glued a label to it. Now “Big Data” is what you and I do. As trivial as this change sounds, we should be grateful for it, as the name seems to resonate with the public and so it helps convey the importance of our field to others better than we had managed to do ourselves. Yet, now that we have everyone’s attention, we need to start clarifying for others – and ourselves – what the revolution means. This is much of what this book is about.
Throughout, we need to remember that for the most part, Big Data is not about the data….
- Merce Crosas, Gary King, James Honaker, Latanya Sweeney. 2015. "Automating Open Science for Big Data." The ANNALS of the American Academy of Political and Social Science, 659, 1, Pp. 260–273.Article Publisher's Version
+ Abstract
The vast majority of social science research presently uses small (MB or GB scale) data sets. These fixed-scale data sets are commonly downloaded to the researcher’s computer where the analysis is performed locally, and are often shared and cited with well-established technologies, such as the Dataverse Project (see Dataverse.org), to support the published results. The trend towards Big Data – including large scale streaming data – is starting to transform research and has the potential to impact policy-making and our understanding of the social, economic, and political problems that affect human societies. However, this research poses new challenges in execution, accountability, preservation, reuse, and reproducibility. Downloading these data sets to a researcher’s computer is infeasible or not practical; hence, analyses take place in the cloud, require unusual expertise, and benefit from collaborative teamwork and novel tool development. The advantage of these data sets in how informative they are also means that they are much more likely to contain highly sensitive personally identifiable information. In this paper, we discuss solutions to these new challenges so that the social sciences can realize the potential of Big Data. - Gary King. 2014. "An Update on Dataverse."Article Publisher's Version Replication Data Replication Data Replication Data
+ Abstract
At the American Political Science Association meetings earlier this year, Gary King, Albert J. Weatherhead III University Professor at Harvard University, gave a presentation on Dataverse. Dataverse is an important tool that many researchers use to archive and share their research materials. As many readers of this blog may already know, the journal that I co-edit, Political Analysis, uses Dataverse to archive and disseminate the replication materials for the articles we publish in our journal. I asked Gary to write some remarks about Dataverse, based on his APSA presentation. His remarks are below. – Michael Alvarez, Editor, Political Analysis. - Myron Gutmann, Mark Abrahamson, Margaret Adams, Micah Altman, Caroline Arms, Kenneth Bollen, Michael Carlson, Jonathan Crabtree, Darrell Donakowski, Gary King, Jaret Lyle, Marc Maynard, Amy Pienta, Richard Rockwell, Lois Rocms-Ferrara, Copeland Young. 2009. "From Preserving the Past to Preserving the Future: The Data-PASS Project and the Challenges of Preserving Digital Social Science Data." Library Trends, 57, Pp. 315–337.Article
+ Abstract
Social science data are an unusual part of the past, present, and future of digital preservation. They are both an unqualified success, due to long-lived and sustainable archival organizations, and in need of further development because not all digital content is being preserved. This article is about the Data Preservation Alliance for Social Sciences (Data-PASS), a project supported by the National Digital Information Infrastructure and Preservation Program (NDIIPP), which is a partnership of five major U.S. social science data archives. Broadly speaking, Data-PASS has the goal of ensuring that at-risk social science data are identified, acquired, and preserved, and that we have a future-oriented organization that could collaborate on those preservation tasks for the future. Throughout the life of the Data-PASS project we have worked to identify digital materials that have never been systematically archived, and to appraise and acquire them. As the project has progressed, however, it has increasingly turned its attention from identifying and acquiring legacy and at-risk social science data to identifying on going and future research projects that will produce data. This article is about the project’s history, with an emphasis on the issues that underlay the transition from looking backward to looking forward. - Gary King. 2007. "An Introduction to the Dataverse Network As an Infrastructure for Data Sharing." Sociological Methods & Research, 36, 2, Pp. 173–199.Article
+ Abstract
We introduce a set of integrated developments in web application software, networking, data citation standards, and statistical methods designed to put some of the universe of data and data sharing practices on somewhat firmer ground. We have focused on social science data, but aspects of what we have developed may apply more widely. The idea is to facilitate the public distribution of persistent, authorized, and verifiable data, with powerful but easy-to-use technology, even when the data are confidential or proprietary. We intend to solve some of the sociological problems of data sharing via technological means, with the result intended to benefit both the scientific community and the sometimes apparently contradictory goals of individual researchers. Winner of the Best Instructional Political Science Website Award, for Dataverse, ITP Section of the American Political Science Association. - Gary King. 2006. "Publication, Publication." PS: Political Science and Politics, 39, Pp. 119–125.Article
+ Abstract
I show herein how to write a publishable paper by beginning with the replication of a published article. This strategy seems to work well for class projects in producing papers that ultimately get published, helping to professionalize students into the discipline, and teaching them the scientific norms of the free exchange of academic information. I begin by briefly revisiting the prominent debate on replication our discipline had a decade ago and some of the progress made in data sharing since. Best Instructional Innovation in the Social Sciences or Social History, Honorable Mention, ICPSR Prize - Gary King. 2003. "The Future of Replication." International Studies Perspectives, 4, Pp. 443–499.Article
+ Abstract
Since the replication standard was proposed for political science research, more journals have required or encouraged authors to make data available, and more authors have shared their data. The calls for continuing this trend are more persistent than ever, and the agreement among journal editors in this Symposium continues this trend. In this article, I offer a vision of a possible future of the replication movement. The plan is to implement this vision via the Virtual Data Center project, which – by automating the process of finding, sharing, archiving, subsetting, converting, analyzing, and distributing data – may greatly facilitate adherence to the replication standard. - Micah Altman, Leonid Andreev, Mark Diggory, Gary King, Daniel Kiskis, Elizabeth Kolster, Michael Krot, Sidney Verba. 2001. "A Digital Library for the Dissemination and Replication of Quantitative Social Science Research." Social Science Computer Review, 19, Pp. 458–470.Article
+ Abstract
The Virtual Data Center (VDC) software is an open-source, digital library system for quantitative data. We discuss what the software does, and how it provides an infrastructure for the management and dissemination of disturbed collections of quantitative data, and the replication of results derived from this data. - Micah Altman, Leonid Andreev, Mark Diggory, Gary King, Elizabeth Kolster, Krot, Sidney Verba, Daniel Kiskis. 2001. "An Introduction to the Virtual Data Center Project and Software." Proceedings of The First ACM+IEEE Joint Conference on Digital Libraries, Pp. 203–204.
- Micah Altman, Leonid Andreev, Mark Diggory, Gary King, Daniel L. Kiskis, Elizabeth Kolster, Michael Krot, Sidney Verba. 2001. "An Overview of the Virtual Data Center Project and Software." Proceedings of The First ACM+IEEE Joint Conference on Digital Libraries, Pp. 203–204.Replication Data
+ Abstract
Software is now superseded by Dataverse. In this paper, we present an overview of the Virtual Data Center (VDC) software, an open-source digital library system for the management and dissemination of distributed collections of quantitative data. (See Dataverse.) The VDC functionality provides everything necessary to maintain and disseminate an individual collection of research studies, including facilities for the storage, archiving, cataloging, translation, and on-line analysis of a particular collection. Moreover, the system provides extensive support for distributed and federated collections including: location-independent naming of objects, distributed authentication and access control, federated metadata harvesting, remote repository caching, and distributed “virtual” collections of remote objects. - Gary King. 1995. "A Revised Proposal, Proposal." PS: Political Science and Politics, XXVIII, Pp. 494–499.
- Gary King. 1995. "Replication, Replication." PS: Political Science and Politics, 28, Pp. 444-52.Article
+ Abstract
Political science is a community enterprise and the community of empirical political scientists need access to the body of data necessary to replicate existing studies to understand, evaluate, and especially build on this work. Unfortunately, the norms we have in place now do not encourage, or in some cases even permit, this aim. Following are suggestions that would facilitate replication and are easy to implement – by teachers, students, dissertation writers, graduate programs, authors, reviewers, funding agencies, and journal and book editors.
Related Papers on New Forms of Data
- Aristides A. N. Patrinos, Hannah Bayer, Paul W. Glimcher, Steven Koonin, Miyoung Chun, Gary King. 2015. "Urban Observatories: City Data Can Inform Decision Theory." Nature, 519, 7543, Pp. 291–291.Article Publisher's Version
+ Abstract
Data are being collected on human behaviour in cities such as London, New York, Singapore and Shanghai, with a view to meeting city dwellers’ needs more effectively. Incorporating decision-making theory into analyses of the data from these ‘urban observatories’ would yield further valuable information. - Gary King. 2011. "Ensuring the Data Rich Future of the Social Sciences." Science, 331, 11 February, Pp. 719-21.Article
+ Abstract
Massive increases in the availability of informative social science data are making dramatic progress possible in analyzing, understanding, and addressing many major societal problems. Yet the same forces pose severe challenges to the scientific infrastructure supporting data sharing, data management, informatics, statistical methodology, and research ethics and policy, and these are collectively holding back progress. I address these changes and challenges and suggest what can be done. - David Lazer, Alex Pentland, Lada Adamic, Sinan Aral, Albert-Laszlo Barabasi, Devon Brewer, Nicholas Christakis, Noshir Contractor, James Fowler, Myron Gutmann, Tony Jebara, Gary King, Michael Macy, Deb Roy, Marshall Van Alstyne. 2009. "Computational Social Science." Science, 323, 5915, Pp. 721–723.Article
+ Abstract
A field is emerging that leverages the capacity to collect and analyze data at a scale that may reveal patterns of individual and group behaviors. - Mark Abrahamson, Kenneth Bollen, Myron Gutmann, Gary King, Amy Pienta. 2009. "Preserving Quantitative Research-Elicited Data for Longitudinal Analysis. New Developments in Archiving Survey Data in the U.S.." Historical Social Research, 34, 3, Pp. 51-59.Article
+ Abstract
Social science data collected in the United States, both historically and at present, have often not been placed in any public archive – even when the data collection was supported by government grants. The availability of the data for future use is, therefore, in jeopardy. Enforcing archiving norms may be the only way to increase data preservation and availability in the future. - Gary King. 2009. "The Changing Evidence Base of Social Science Research." In The Future of Political Science: 100 Perspectives, edited by Gary King, Kay Schlozman, and Norman Nie. New York: Routledge Press.Book Chapter
+ Abstract
This (two-page) article argues that the evidence base of political science and the related social sciences are beginning an underappreciated but historic change.
International Conflict 🔗
Methods for coding, analyzing, and forecasting international conflict and state failure. Evidence that the causes of conflict, theorized to be important but often found to be small or ephemeral, are indeed tiny for the vast majority of dyads, but are large, stable, and replicable wherever the ex ante probability of conflict is large.
- Gary King, Langche Zeng. 2007. "When Can History Be Our Guide? The Pitfalls of Counterfactual Inference." International Studies Quarterly, Pp. 183-210.Article
+ Abstract
Inferences about counterfactuals are essential for prediction, answering “what if” questions, and estimating causal effects. However, when the counterfactuals posed are too far from the data at hand, conclusions drawn from well-specified statistical analyses become based on speculation and convenient but indefensible model assumptions rather than empirical evidence. Unfortunately, standard statistical approaches assume the veracity of the model rather than revealing the degree of model-dependence, and so this problem can be hard to detect. We develop easy-to-apply methods to evaluate counterfactuals that do not require sensitivity testing over specified classes of models. If an analysis fails the tests we offer, then we know that substantive results are sensitive to at least some modeling choices that are not based on empirical evidence. We use these methods to evaluate the extensive scholarly literatures on the effects of changes in the degree of democracy in a country (on any dependent variable) and separate analyses of the effects of UN peacebuilding efforts. We find evidence that many scholars are inadvertently drawing conclusions based more on modeling hypotheses than on their data. For some research questions, history contains insufficient information to be our guide.
Replication data at the Harvard Dataverse: https://doi.org/10.7910/DVN/EK886K.
- Lee Epstein, Daniel E. Ho, Gary King, Jeffrey A. Segal. 2005. "The Supreme Court During Crisis: How War Affects only Non-War Cases." New York University Law Review, 80, Pp. 1–116.Article
+ Abstract
Does the U.S. Supreme Court curtail rights and liberties when the nation’s security is under threat? In hundreds of articles and books, and with renewed fervor since September 11, 2001, members of the legal community have warred over this question. Yet, not a single large-scale, quantitative study exists on the subject. Using the best data available on the causes and outcomes of every civil rights and liberties case decided by the Supreme Court over the past six decades and employing methods chosen and tuned especially for this problem, our analyses demonstrate that when crises threaten the nation’s security, the justices are substantially more likely to curtail rights and liberties than when peace prevails. Yet paradoxically, and in contradiction to virtually every theory of crisis jurisprudence, war appears to affect only cases that are unrelated to the war. For these cases, the effect of war and other international crises is so substantial, persistent, and consistent that it may surprise even those commentators who long have argued that the Court rallies around the flag in times of crisis. On the other hand, we find no evidence that cases most directly related to the war are affected. We attempt to explain this seemingly paradoxical evidence with one unifying conjecture: Instead of balancing rights and security in high stakes cases directly related to the war, the Justices retreat to ensuring the institutional checks of the democratic branches. Since rights-oriented and process-oriented dimensions seem to operate in different domains and at different times, and often suggest different outcomes, the predictive factors that work for cases unrelated to the war fail for cases related to the war. If this conjecture is correct, federal judges should consider giving less weight to legal principles outside of wartime but established during wartime, and attorneys should see it as their responsibility to distinguish cases along these lines. Winner of the McGraw-Hill Awardfor the best journal article on law and courts written by a political scientist and published during the previous calendar year; Law and Society Association Prize, Runner up, to “recognize exceptional scholarship in the field of sociolegal studies for an article published in the previous two years”;Pi Sigma Alpha Award, for the best paper delivered at the previous year’s MWPSA Conference; the Robert H. Durr Award, for “the best paper applying quantitative methods to a substantive problem” at the previous year’s MWPSA Conference; and the American Judicature Society Award, Honorable Mention, for the best paper presented at the previous year’s meetings of the American, Midwest, Northeastern, Southern, Southwest, or Western Political Science Associations.
Replication data at the Harvard Dataverse: https://doi.org/10.7910/DVN/OLD7MB.
- Nathaniel Beck, Gary King, Langche Zeng. 2004. "Theory and Evidence in International Conflict: A Response to de Marchi, Gelpi, and Grynaviski." 98, Pp. 379-89.Article
+ Abstract
We thank Scott de Marchi, Christopher Gelpi, and Jeffrey Grynaviski (2003 and hereinafter dGG) for their careful attention to our work (Beck, King, and Zeng, 2000 and hereinafter BKZ) and for raising some important methodological issues that we agree deserve readers’ attention. We are pleased that dGG’s analyses are consistent with the theoretical conjecture about international conflict put forward in BKZ –- “The causes of conflict, theorized to be important but often found to be small or ephemeral, are indeed tiny for the vast majority of dyads, but they are large stable and replicable whenever the ex ante probability of conflict is large” (BKZ, p.21) –- and that dGG agree with our main methodological point that out-of-sample forecasting performance should always be one of the standards used to judge studies of international conflict, and indeed most other areas of political science. However, dGG frequently err when they draw methodological conclusions. Their central claim involves the superiority of logit over neural network models for international conflict data, as judged by forecasting performance and other properties such as ease of use and interpretation (“neural networks hold few unambiguous advantages… and carry significant costs” relative to logit and dGG, p.14). We show here that this claim, which would be regarded as stunning in any of the diverse fields in which both methods are more commonly used, is false. We also show that dGG’s methodological errors and the restrictive model they favor cause them to miss and mischaracterize crucial patterns in the causes of international conflict. We begin in the next section by summarizing the growing support for our conjecture about international conflict. The second section discusses the theoretical reasons why neural networks dominate logistic regression, correcting a number of methodological errors. The third section then demonstrates empirically, in the same data as used in BKZ and dGG, that neural networks substantially outperform dGG’s logit model. We show that neural networks improve on the forecasts from logit as much as logit improves on a model with no theoretical variables. We also show how dGG’s logit analysis assumed, rather than estimated, the answer to the central question about the literature’s most important finding, the effect of democracy on war. Since this and other substantive assumptions underlying their logit model are wrong, their substantive conclusion about the democratic peace is also wrong. The neural network models we used in BKZ not only avoid these difficulties, but they, or one of the other methods available that do not make highly restrictive assumptions about the exact functional form, are just what is called for to study the observable implications of our conjecture.
Replication data at the Harvard Dataverse: https://doi.org/10.7910/DVN/S7JLEL.
- Gary King, Will Lowe. 2003. "An Automated Information Extraction Tool For International Conflict Data With Performance As Good As Human Coders: A Rare Events Evaluation Design." International Organization, 57, Pp. 617-42.Article
+ Abstract
Despite widespread recognition that aggregated summary statistics on international conflict and cooperation miss most of the complex interactions among nations, the vast majority of scholars continue to employ annual, quarterly, or occasionally monthly observations. Daily events data, coded from some of the huge volume of news stories produced by journalists, have not been used much for the last two decades. We offer some reason to change this practice, which we feel should lead to considerably increased use of these data. We address advances in event categorization schemes and software programs that automatically produce data by “reading” news stories without human coders. We design a method that makes it feasible for the first time to evaluate these programs when they are applied in areas with the particular characteristics of international conflict and cooperation data, namely event categories with highly unequal prevalences, and where rare events (such as highly conflictual actions) are of special interest. We use this rare events design to evaluate one existing program, and find it to be as good as trained human coders, but obviously far less expensive to use. For large scale data collections, the program dominates human coding. Our new evaluative method should be of use in international relations, as well as more generally in the field of computational linguistics, for evaluating other automated information extraction tools. We believe that the data created by programs similar to the one we evaluated should see dramatically increased use in international relations research. To facilitate this process, we are releasing with this article data on 4.3 million international events, covering the entire world for the last decade. - Christopher Murray, Gary King, Alan Lopez, Niels Tomijima, Etienne Krug. 2002. "Armed Conflict As a Public Health Problem." BMJ (British Medical Journal), 324, Pp. 346–349.Article
+ Abstract
Armed conflict is a major cause of injury and death worldwide, but we need much better methods of quantification before we can accurately assess its effect. Armed conflict between warring states and groups within states have been major causes of ill health and mortality for most of human history. Conflict obviously causes deaths and injuries on the battlefield, but also health consequences from the displacement of populations, the breakdown of health and social services, and the heightened risk of disease transmission. Despite the size of the health consequences, military conflict has not received the same attention from public health research and policy as many other causes of illness and death. In contrast, political scientists have long studied the causes of war but have primarily been interested in the decision of elite groups to go to war, not in human death and misery. We review the limited knowledge on the health consequences of conflict, suggest ways to improve measurement, and discuss the potential for risk assessment and for preventing and ameliorating the consequences of conflict. - Gary King, Christopher J.L. Murray. 2002. "Rethinking Human Security." Political Science Quarterly, 116, Pp. 585–610.Article
+ Abstract
In the last two decades, the international community has begun to conclude that attempts to ensure the territorial security of nation-states through military power have failed to improve the human condition. Despite astronomical levels of military spending, deaths due to military conflict have not declined. Moreover, even when the borders of some states are secure from foreign threats, the people within those states do not necessarily have freedom from crime, enough food, proper health care, education, or political freedom. In response to these developments, the international community has gradually moved to combine economic development with military security and other basic human rights to form a new concept of “human security”. Unfortunately, by common assent the concept lacks both a clear definition, consistent with the aims of the international community, and any agreed upon measure of it. In this paper, we propose a simple, rigorous, and measurable definition of human security: the expected number of years of future life spent outside the state of “generalized poverty”. Generalized poverty occurs when an individual falls below the threshold in any key domain of human well-being. We consider improvements in data collection and methods of forecasting that are necessary to measure human security and then introduce an agenda for research and action to enhance human security that follows logically in the areas of risk assessment, prevention, protection, and compensation. - Gary King, Langche Zeng. 2001. "Explaining Rare Events in International Relations." International Organization, 55, Pp. 693–715.Article
+ Abstract
Some of the most important phenomena in international conflict are coded as “rare events data,” binary dependent variables with dozens to thousands of times fewer events, such as wars, coups, etc., than “nonevents”. Unfortunately, rare events data are difficult to explain and predict, a problem that seems to have at least two sources. First, and most importantly, the data collection strategies used in international conflict are grossly inefficient. The fear of collecting data with too few events has led to data collections with huge numbers of observations but relatively few, and poorly measured, explanatory variables. As it turns out, more efficient sampling designs exist for making valid inferences, such as sampling all available events (e.g., wars) and a tiny fraction of non-events (peace). This enables scholars to save as much as 99% of their (non-fixed) data collection costs, or to collect much more meaningful explanatory variables. Second, logistic regression, and other commonly used statistical procedures, can underestimate the probability of rare events. We introduce some corrections that outperform existing methods and change the estimates of absolute and relative risks by as much as some estimated effects reported in the literature. We also provide easy-to-use methods and software that link these two results, enabling both types of corrections to work simultaneously.
Replication data at the Harvard Dataverse: https://doi.org/10.7910/DVN/RNSU7V.
- Gary King, Langche Zeng. 2001. "Improving Forecasts of State Failure." World Politics, 53, Pp. 623–658.Article
+ Abstract
We offer the first independent scholarly evaluation of the claims, forecasts, and causal inferences of the State Failure Task Force and their efforts to forecast when states will fail. State failure refers to the collapse of the authority of the central government to impose order, as in civil wars, revolutionary wars, genocides, politicides, and adverse or disruptive regime transitions. This task force, set up at the behest of Vice President Gore in 1994, has been led by a group of distinguished academics working as consultants to the U.S. Central Intelligence Agency. State Failure Task Force reports and publications have received attention in the media, in academia, and from public policy decision-makers. In this article, we identify several methodological errors in the task force work that cause their reported forecast probabilities of conflict to be too large, their causal inferences to be biased in unpredictable directions, and their claims of forecasting performance to be exaggerated. However, we also find that the task force has amassed the best and most carefully collected data on state failure in existence, and the required corrections which we provide, although very large in effect, are easy to implement. We also reanalyze their data with better statistical procedures and demonstrate how to improve forecasting performance to levels significantly greater than even corrected versions of their models. Although still a highly uncertain endeavor, we are as a consequence able to offer the first accurate forecasts of state failure, along with procedures and results that may be of practical use in informing foreign policy decision making. We also describe a number of strong empirical regularities that may help in ascertaining the causes of state failure.
Replication data at the Harvard Dataverse: https://doi.org/10.7910/DVN/BS4236.
- Gary King. 2001. "Proper Nouns and Methodological Propriety: Pooling Dyads in International Relations Data." International Organization, 55, Pp. 497–507.Article
+ Abstract
The intellectual stakes at issue in this symposium are very high: Green, Kim, and Yoon (2000 and hereinafter GKY) apply their proposed methodological prescriptions and conclude that they key findings in the field is wrong and democracy “has no effect on militarized disputes.” GKY are mainly interested in convincing scholars about their methodological points and see themselves as having no stake in the resulting substantive conclusions. However, their methodological points are also high stakes claims: if correct, the vast majority of statistical analyses of military conflict ever conducted would be invalidated. GKY say they “make no attempt to break new ground statistically,” but, as we will see, this both understates their methodological contribution to the field and misses some unique features of their application and data in international relations. On the ltter, GKY’s critics are united: Oneal and Russett (2000) conclude that GKY’s method “produces distorted results,” and show even in GKY’s framework how democracy’s effect can be reinstated. Beck and Katz (2000) are even more unambiguous: “GKY’s conclusion, in table 3, that variables such as democracy have no pacific impact, is simply nonsense…GKY’s (methodological) proposal…is NEVER a good idea.” My given task is to sort out and clarify these conflicting claims and counterclaims. The procedure I followed was to engage in extensive discussions with the participants that included joint reanalyses provoked by our discussions and passing computer program code (mostly with Monte Carlo simulations) back and forth to ensure we were all talking about the same methods and agreed with the factual results. I learned a great deal from this process and believe that the positions of the participants are now a lot closer than it may seem from their written statements. Indeed, I believe that all the participants now agree with what I have written here, even though they would each have different emphases (and although my believing there is agreement is not the same as there actually being agreement!). - Nathaniel Beck, Gary King, Langche Zeng. 2000. "Improving Quantitative Studies of International Conflict: A Conjecture." American Political Science Review, 94, Pp. 21–36.Article
+ Abstract
We address a well-known but infrequently discussed problem in the quantitative study of international conflict: Despite immense data collections, prestigious journals, and sophisticated analyses, empirical findings in the literature on international conflict are often unsatisfying. Many statistical results change from article to article and specification to specification. Accurate forecasts are nonexistant. In this article we offer a conjecture about one source of this problem: The causes of conflict, theorized to be important but often found to be small or ephemeral, are indeed tiny for the vast majority of dyads, but they are large, stable, and replicable wherever the ex ante probability of conflict is large. This simple idea has an unexpectedly rich array of observable implications, all consistent with the literature. We directly test our conjecture by formulating a statistical model that includes critical features. Our approach, a version of a “neural network” model, uncovers some interesting structural features of international conflict, and as one evaluative measure, forecasts substantially better than any previous effort. Moreover, this improvement comes at little cost, and it is easy to evaluate whether the model is a statistical improvement over the simpler models commonly used. Winner of The Gosnell Prize, for the best work in political methodology presented at any political science conference in the preceding year.
Replication data at the Harvard Dataverse: https://doi.org/10.7910/DVN/ZGDYNQ.
- Gary King. 1989. "Event Count Models for International Relations: Generalizations and Applications." International Studies Quarterly, 33, Pp. 123–147.Article
+ Abstract
International relations theorists tend to think in terms of continuous processes. Yet we observe only discrete events, such as wars or alliances, and summarize them in terms of the frequency of occurrence. As such, most empirical analyses in international relations are based on event count variables. Unfortunately, analysts have generally relied on statistical techniques that were designed for continuous data. This mismatch between theory and method has caused bias, inefficiency, and numerous inconsistencies in both theoretical arguments and empirical findings throughout the literature. This article develops a much more powerful approach to modeling and statistical analysis based explicity on estimating continuous processes from observed event counts. To demonstrate this class of models, I present several new statistical techniques developed for and applied to different areas of international relations. These include the influence of international alliances on the outbreak of war, the contagious process of multilateral economic sanctions, and reciprocity in superpower conflict. I also show how one can extract considerably more information from existing data and relate substantive theory to empirical analyses more explicitly with this approach. - Gary King. 1986. "Political Parties and Foreign Policy: A Structuralist Approach." Political Psychology, 7, Pp. 83–101.
+ Abstract
This article introduces the theory and approach of structural anthropology and applies it to a problem in American political science. Through this approach, the “bipartisan foreign policy hypothesis” and that “two presidencies hypothesis” are reformulated and reconsidered. Until now participants in the debate over each have only rarely built on, or even cited, the other’s research. An additional problem is that the widespread conventional wisdom in support of the two hypotheses is inconsistent with systematic scholarly analyses. This paper demonstrates that the two hypotheses are drawn from the same underlying structure. Each hypothesis and the theoretical model it implies is conceptually and empirically extended to take into account the differences between congressional leaders and members. Then, historical examples and statistical analyses of House roll call data are used to demonstrate that the hypotheses, while sometimes supported for the congressional members, are far more applicable to leadership decision making. Conclusions suggest that conventional wisdom be revised to take these differences into account.
Legislative Redistricting 🔗
The definition of partisan symmetry as a standard for fairness in redistricting; methods and software for measuring partisan bias and electoral responsiveness; discussion of U.S. Supreme Court rulings about this work. Evidence that U.S. redistricting reduces bias and increases responsiveness, and that the electoral college is fair; applications to legislatures, primaries, and multiparty systems.
U.S. Legislatures
- Ian Ayres, Richard A. Berk, Richard R.W. Brooks, Daniel E. Ho, Gary King, Kevin Quinn, Donald B. Rubin, Sherod Thaxton. 2022. "Brief of Empirical Scholars As Amici Curiae in Support of Respondents."Brief
+ Abstract
Amici curiae are leaders in the field of quantitative social science and statistical methodology. Amici submit this brief to point out the substantial methodological flaws in the “mismatch” research discussed in the Brief for Richard Sander as Amicus Curiae in Support of Petitioner. Professor Sander’s mismatch hypothesis is unsupported and based on work that fails to adhere to basic tenets of research design. - Aaron Kaufman, Gary King, Mayya Komisarchik. 2021. "How to Measure Legislative District Compactness If You Only Know It When You See It." American Journal of Political Science, 65, 3, Pp. 533–550.Article Publisher's Version Appendix
+ Abstract
The US Supreme Court, many state constitutions, and numerous judicial opinions require that legislative districts be “compact,” a concept assumed so simple that the only definition given in the law is “you know it when you see it.” Academics, in contrast, have concluded that the concept is so complex that it has multiple theoretical dimensions requiring large numbers of conflicting empirical measures. We hypothesize that both are correct – that the concept is complex and multidimensional, but one particular unidimensional ordering represents a common understanding of compactness in the law and across people. We develop a survey method designed to elicit this understanding with high levels of intracoder and intercoder reliability (even though the standard paired comparison approach fails). We then create a statistical model that predicts, with high accuracy and solely from the geometric features of the district, compactness evaluations by judges and other public officials from many jurisdictions, as well as redistricting consultants and expert witnesses, law professors, law students, graduate students, undergraduates, ordinary citizens, and Mechanical Turk workers. As a companion to this paper, we offer data on compactness from our validated measure for 18,215 US state legislative and congressional districts, as well as software to compute this measure from any district shape. We also discuss what may be the wider applicability of our general methodological approach to measuring important concepts that you only know when you see. - Cynthia Dwork, Ruth Greenwood, Gary King. 2021. "There's a Simple Solution to the Latest Census Fight." Boston Globe, Pp. A9.Article Publisher's Version
+ Abstract
We offer a solution to debates over the use of differential privacy in releasing US Census Data. - Jonathan N. Katz, Gary King, Elizabeth Rosenblatt. 2020. "Theoretical Foundations and Empirical Evaluations of Partisan Fairness in District-Based Democracies." American Political Science Review, 114, 1, Pp. 164–178.Article
+ Abstract
We clarify the theoretical foundations of partisan fairness standards for district-based democratic electoral systems, including essential assumptions and definitions that have not been recognized, formalized, or in some cases even discussed. We also offer extensive empirical evidence for assumptions with observable implications. Throughout, we follow a fundamental principle of statistical inference too often ignored in this literature – defining the quantity of interest separately so its measures can be proven wrong, evaluated, or improved. This enables us to prove which of the many newly proposed fairness measures are statistically appropriate and which are biased, limited, or not measures of the theoretical quantity they seek to estimate at all. Because real world redistricting and gerrymandering involves complicated politics with numerous participants and conflicting goals, measures biased for partisan fairness sometimes still provide useful descriptions of other aspects of electoral systems.
Replication data at the Harvard Dataverse: https://doi.org/10.7910/DVN/FTYHPJ.
- Gary King. 2018. "Edited Transcript of a Talk on Partisan Symmetry at the 'Redistricting and Representation Forum'." Bulletin of the American Academy of Arts and Sciences, Winter, Pp. 55-58.Article
+ Abstract
The origin, meaning, estimation, and application of the concept of partisan symmetry in legislative redistricting, and the justiciability of partisan gerrymandering. An edited transcript of a talk at the “Redistricting and Representation Forum,” American Academy of Arts & Sciences, Cambridge, MA 11/8/2017.
Here also is a video of the original talk.
- Gary King, Robert Browning. 2017. "How to Conquer Partisan Gerrymandering." Boston Globe (Op-Ed), 292 , 179 , Pp. A10.Article Publisher's Version
+ Abstract
PARTISAN GERRYMANDERING has long been reviled for thwarting the will of the voters. Yet while voters are acting disgusted, the US Supreme Court has only discussed acting — declaring they have the constitutional right to fix the problem, but doing nothing. But as better data and computer algorithms are now making gerrymandering increasingly effective, continuing to sidestep the issue could do permanent damage to American democracy. In Gill v. Whitford, the soon-to-be-decided challenge to Wisconsin’s 2011 state Assembly redistricting plan, the court could finally fix the problem for the whole country. Judging from the oral arguments, the key to the case is whether the court endorses the concept of “partisan symmetry,” a specific standard for treating political parties equally in allocating legislative seats based on voting. - Gary King, Benjamin Schneer. 2012. "Data, Analyses, and Reports for the Arizona Independent Redistricting Commission, Filed With the U.S. Department of Justice."
+ Abstract
Expert reports about Arizona congressional elections and legislative elections, filed with the US Department of Justice. - Guido Imbens, Donald B. Rubin, Gary King, Richard A. Berk, Daniel E. Ho, Kevin M. Quinn, D. James Greiner, Ian Ayres, Richard Brooks, Paul Oyer, Richard Lempert. 2012. "Brief of Empirical Scholars As Amici Curiae."Brief
+ Abstract
In Grutter v. Bollinger, this Court held that a state has a compelling interest in attaining a diverse student body for the benefit of all students, and thatthis compelling interest justifies the consideration of race as a factor in university admissions. See 539 U.S. 306, 325, 328 (2003). In this, the latest case to consider the constitutionality of affirmative-action admissions policies, Professor Richard H. Sander, along with lawyer and journalist Stuart S. Taylor, Jr., filed a brief amici curiae arguing that social-science research has shown affirmative action to be harmful to minority students. See Brief Amici Curiae for Richard Sander and Stuart Taylor, Jr. in Supportof Neither Party (“Sander-Taylor Brief”) 2. According to them, a “growing volume of very careful research, some of it completely unrebutted by dissenting work” has found that affirmative-action practices are not having their intended effect. Id.; see also Brief Amici Curiae of Gail Heriot et al. in Support of Petitioner (“Three Commissioners Brief”) 14 (“The Commissioner Amici are aware of no empirical research that challenges [Sander’s] findings.”). But, as amici will show, the principal research on which Sander and Taylor rely for their conclusion about the negative effects of affirmative action—Sander’s so-called “mismatch” hypothesis2—is far from “unrebutted.” Sander-Taylor Brief 2. Since Sander first published findings in support of a"mismatch" in 2004, that research has been subjected to wide-ranging criticism. Nor is Sander’s research “very careful.” Id. As some of those critiques discussin detail, Sander’s research has major methodologicalflaws—misapplying basic principles of causal inference—that call into doubt his controversial conclusions about affirmative action. The Sander “mismatch” research—and its provocative claim that, on average, minority students admitted through affirmative action would be better off attending less selective colleges and universities—is not good social science. Sander’s research has “significantly overestimated the costs of affirmative action and failed to demonstrate benefits from ending it.” David L. Chambers et al., The Real Impact of Affirmative Action in American Law Schools: An Empirical Critique of Richard Sander’s Study, 57 Stan. L. Rev. 1855, 1857 (2005). That research, which consists of weak empirical contentions that fail to meet the basic tenets of rigorous social-science research, provides no basis for this Court to revisit longstanding precedent supporting the individualized consideration of race in admissions. Cf. Grutter, 539 U.S. at 334 (“Universities can * * * consider race or ethnicity more flexibly as a ‘plus’ factor in the context of individualized consideration of each and every applicant.”) (citing Regents of Univ. of Cal. v. Bakke, 438 U.S. 265, 315-316 (1978) (opinion of Powell, J.,)).In light of the significant methodological flaws on which it rests, Sander’s research does not constitute credible evidence that affirmative action practices are harmful to minorities, let alone that the diversity rationale at the heart of Grutter is at odds with social science. - Bernard Grofman, Gary King. 2008. "The Future of Partisan Symmetry As a Judicial Test for Partisan Gerrymandering After LULAC V. Perry." Election Law Journal, 6, 1, Pp. 2-35.Article
+ Abstract
While the Supreme Court in Bandemer v. Davis found partisan gerrymandering to be justiciable, no challenged redistricting plan in the subsequent 20 years has been held unconstitutional on partisan grounds. Then, in Vieth v. Jubilerer, five justices concluded that some standard might be adopted in a future case, if a manageable rule could be found. When gerrymandering next came before the Court, in LULAC v. Perry, we along with our colleagues filed an Amicus Brief (King et al., 2005), proposing the test be based in part on the partisan symmetry standard. Although the issue was not resolved, our proposal was discussed and positively evaluated in three of the opinions, including the plurality judgment, and for the first time for any proposal the Court gave a clear indication that a future legal test for partisan gerrymandering will likely include partisan symmetry. A majority of Justices now appear to endorse the view that the measurement of partisan symmetry may be used in partisan gerrymandering claims as “a helpful (though certainly not talismanic) tool” (Justice Stevens, joined by Justice Breyer), provided one recognizes that “asymmetry alone is not a reliable measure of unconstitutional partisanship” and possibly that the standard would be applied only after at least one election has been held under the redistricting plan at issue (Justice Kennedy, joined by Justices Souter and Ginsburg). We use this essay to respond to the request of Justices Souter and Ginsburg that “further attention … be devoted to the administrability of such a criterion at all levels of redistricting and its review.” Building on our previous scholarly work, our Amicus Brief, the observations of these five Justices, and a supporting consensus in the academic literature, we offer here a social science perspective on the conceptualization and measurement of partisan gerrymandering and the development of relevant legal rules based on what is effectively the Supreme Court’s open invitation to lower courts to revisit these issues in the light of LULAC v. Perry.
The concept of partisan symmetry
- Jonathan Katz, Gary King, Elizabeth Rosenblatt. 2023. "The Essential Role of Statistical Inference in Evaluating Electoral Systems: A Response to DeFord et Al.." Political Analysis, 31, 3, Pp. 325–331.Article
+ Abstract
Katz, King, and Rosenblatt (2020) introduces a theoretical framework for understanding redistricting and electoral systems, built on basic statistical and social science principles of inference. DeFord et al. (Forthcoming, 2021) instead focuses solely on descriptive measures, which lead to the problems identified in our arti- cle. In this paper, we illustrate the essential role of these basic principles and then offer statistical, mathematical, and substantive corrections required to apply DeFord et al.’s calculations to social science questions of interest, while also showing how to easily resolve all claimed paradoxes and problems. We are grateful to the authors for their interest in our work and for this opportunity to clarify these principles and our theoretical framework.
Replication data at the Harvard Dataverse: https://doi.org/10.7910/DVN/AFTR6W.
- Heather K. Gerken, Jonathan N. Katz, Gary King, Larry J. Sabato, Samuel S.-H. Wang. 2017. "Brief of Heather K. Gerken, Jonathan N. Katz, Gary King, Larry J. Sabato, and Samuel S.-H. Wang As Amici Curiae in Support of Appellees."Brief
+ Abstract
SUMMARY OF ARGUMENT Plaintiffs ask this Court to do what it has done many times before. For generations, it has resolved cases involving elections and cases on which elections ride. It has adjudicated controversies that divide the American people and those, like this one, where Americans are largely in agreement. In doing so, the Court has sensibly adhered to its long-standing and circumspect approach: it has announced a workable principle, one that lends itself to a manageable test, while allowing the lower courts to work out the precise contours of that test with time and experience.
Partisan symmetry, the principle put forward by the plaintiffs, is just such a workable principle. The standard is highly intuitive, deeply rooted in history, and accepted by virtually all social scientists. Tests for partisan symmetry are reliable, transparent, and easy to calculate without undue reliance on experts or unnecessary judicial intrusion on state redistricting judgments. Under any of these tests, Wisconsin’s districts cannot withstand constitutional scrutiny.
- Gary King, Bernard Grofman, Andrew Gelman, Jonathan Katz. 2005. "Brief of Amici Curiae Professors Gary King, Bernard Grofman, Andrew Gelman, and Jonathan Katz in Support of Neither Party."Brief
+ Abstract
For context, see Bernard Grofman and Gary King. 2008. “The Future of Partisan Symmetry as a Judicial Test for Partisan Gerrymandering after LULAC v. Perry.” Election Law Journal, 6, 1, Pp. 2-35. - Gary King, John Bruce, Andrew Gelman. 1996. "Racial Fairness in Legislative Redistricting." In Classifying by Race, edited by Paul Peterson, Pp. 85-110. Princeton: Princeton University Press.Book Chapter
+ Abstract
In this chapter, we study standards of racial fairness in legislative redistricting- a field that has been the subject of considerable legislation, jurisprudence, and advocacy, but very little serious academic scholarship. We attempt to elucidate how basic concepts about “color-blind” societies, and similar normative preferences, can generate specific practical standards for racial fairness in representation and redistricting. We also provide the normative and theoretical foundations on which concepts such as proportional representation rest, in order to give existing preferences of many in the literature a firmer analytical foundation. - Gary King, Robert Browning. 1987. "Democratic Representation and Partisan Bias in Congressional Elections." American Political Science Review, 81, Pp. 1252–1273.Article
+ Abstract
The translation of citizen votes into legislative seats is of central importance in democratic electoral systems. It has been a longstanding concern among scholars in political science and in numerous other disciplines. Through this literature, two fundamental tenets of democratic theory, partisan bias and democratic representation, have often been confused. We develop a general statistical model of the relationship between votes and seats and separate these two important concepts theoretically and empirically. In so doing, we also solve several methodological problems with the study of seats, votes and the cube law. An application to U.S. congressional districts provides estimates of bias and representation for each state and deomonstrates the model’s utility. Results of this application show distinct types of representation coexisting in U.S. states. Although most states have small partisan biases, there are some with a substantial degree of bias. - Robert Browning, Gary King. 1987. "Seats, Votes, and Gerrymandering: Measuring Bias and Representation in Legislative Redistricting." Law and Policy, 9, Pp. 305–322.Article
+ Abstract
The Davis v. Bandemer case focused much attention on the problem of using statistical evidence to demonstrate the existence of political gerrymandering. In this paper, we evaluate the uses and limitations of measures of the seat-votes relationship in the Bandemer case. We outline a statistical method we have developed that can be used to estimate bias and the form of representation in legislative redistricting. We apply this method to Indiana State House and Senate elections for the period 1972 to 1984 and demonstrate a maximum bias 6.2% toward the Republicans in the House and a 2.8% bias in the Senate.
Methods for measuring partisan bias and electoral responsiveness
- Andrew Gelman, Gary King. 1994. "A Unified Method of Evaluating Electoral Systems and Redistricting Plans." American Journal of Political Science, 38, Pp. 514–554.Article
+ Abstract
We derive a unified statistical method with which one can produce substantially improved definitions and estimates of almost any feature of two-party electoral systems that can be defined based on district vote shares. Our single method enables one to calculate more efficient estimates, with more trustworthy assessments of their uncertainty, than each of the separate multifarious existing measures of partisan bias, electoral responsiveness, seats-votes curves, expected or predicted vote in each district in a legislature, the probability that a given party will win the seat in each district, the proportion of incumbents or others who will lose their seats, the proportion of women or minority candidates to be elected, the incumbency advantage and other causal effects, the likely effects on the electoral system and district votes of proposed electoral reforms, such as term limitations, campaign spending limits, and drawing majority-minority districts, and numerous others. To illustrate, we estimate the partisan bias and electoral responsiveness of the U.S. House of Representatives since 1900 and evaluate the fairness of competing redistricting plans for the 1992 Ohio state legislature.
Replication data at the Harvard Dataverse: https://doi.org/10.7910/DVN/MEJOPN.
- Andrew Gelman, Gary King. 1990. "Estimating the Electoral Consequences of Legislative Redistricting." Journal of the American Statistical Association, 85, Pp. 274–282.Article
+ Abstract
We analyze the effects of redistricting as revealed in the votes received by the Democratic and Republican candidates for state legislature. We develop measures of partisan bias and the responsiveness of the composition of the legislature to changes in statewide votes. Our statistical model incorporates a mixed hierarchical Bayesian and non-Bayesian estimation, requiring simulation along the lines of Tanner and Wong (1987). This model provides reliable estimates of partisan bias and responsiveness along with measures of their variabilities from only a single year of electoral data. This allows one to distinguish systematic changes in the underlying electoral system from typical election-to-election variability. - Gary King. 1989. "Representation Through Legislative Redistricting: A Stochastic Model." American Journal of Political Science, 33, Pp. 787–824.Article
+ Abstract
This paper builds a stochastic model of the processes that give rise to observed patterns of representation and bias in congressional and state legislative elections. The analysis demonstrates that partisan swing and incumbency voting, concepts from the congressional elections literature, have determinate effects on representation and bias, concepts from the redistricting literature. The model shows precisely how incumbency and increased variability of partisan swing reduce the responsiveness of the electoral system and how partisan swing affects whether the system is biased toward one party or the other. Incumbency, and other causes of unresponsive representation, also reduce the effect of partisan swing on current levels of partisan bias. By relaxing the restrictive portions of the widely applied “uniform partisan swing” assumption, the theoretical analysis leads directly to an empirical model enabling one more reliably to estimate responsiveness and bias from a single year of electoral data. Applying this to data from seven elections in each of six states, the paper demonstrates that redistricting has effects in predicted directions in the short run: partisan gerrymandering biases the system in favor of the party in control and, by freeing up seats held by opposition party incumbents, increases the system’s responsiveness. Bipartisan-controlled redistricting appears to reduce bias somewhat and dramatically to reduce responsiveness. Nonpartisan redistricting processes substantially increase responsiveness but do not have as clear an effect on bias. However, after only two elections, prima facie evidence for redistricting effects evaporate in most states. Finally, across every state and type of redistricting process, responsiveness declined significantly over the course of the decade. This is clear evidence that the phenomenon of “vanishing marginals,” recognized first in the U.S. Congress literature, also applies to these different types of state legislative assemblies. It also strongly suggests that redistricting could not account for this pattern.
Paradoxical benefits of redistricting
- Andrew Gelman, Gary King. 1996. "Advantages of Conflictual Redistricting." In Fixing the Boundary: Defining and Redefining Single-Member Electoral Districts, edited by Iain McLean and David Butler, Pp. 207–218. Aldershot, England: Dartmouth Publishing Company.Book Chapter
+ Abstract
This article describes the results of an analysis we did of state legislative elections in the United States, where each state is required to redraw the boundaries of its state legislative districts every ten years. In the United States, redistrictings are sometimes controlled by the Democrats, sometimes by the Republicans, and sometimes by bipartisan committees, but never by neutral boundary commissions. Our goal was to study the consequences of redistricting and at the conclusion of this article, we discuss how our findings might be relevant to British elections. - Andrew Gelman, Gary King. 1994. "Enhancing Democracy Through Legislative Redistricting." American Political Science Review, 88, Pp. 541–559.Article
+ Abstract
We demonstrate the surprising benefits of legislative redistricting (including partisan gerrymandering) for American representative democracy. In so doing, our analysis resolves two long-standing controversies in American politics. First, whereas some scholars believe that redistricting reduces electoral responsiveness by protecting incumbents, others, that the relationship is spurious, we demonstrate that both sides are wrong: redistricting increases responsiveness. Second, while some researchers believe that gerrymandering dramatically increases partisan bias and others deny this effect, we show both sides are in a sense correct. Gerrymandering biases electoral systems in favor of the party that controls the redistricting as compared to what would have happened if the other party controlled it, but any type of redistricting reduces partisan bias as compared to an electoral system without redistricting. Incorrect conclusions in both literatures resulted from misjudging the enormous uncertainties present during redistricting periods, making simplified assumptions about the redistricters’ goals, and using inferior statistical methods. Winner of The Heinz Eulau Award, for the best article published in the American Political Science Reviewfrom the previous year, from the American Political Science AssociationReplication data at the Harvard Dataverse:https://doi.org/10.7910/DVN/QQ1AGU.
Other Districting Systems
- Andrew Gelman, Jonathan Katz, Gary King. 2004. "Empirically Evaluating the Electoral College." In Rethinking the Vote: The Politics and Prospects of American Electoral Reform, edited by Ann Crigler, Marion Just, and Edward McCaffery, Pp. 75-88. New York: Oxford University Press.Book Chapter
+ Abstract
The 2000 U.S. presidential election rekindled interest in possible electoral reform. While most of the popular and academic accounts focused on balloting irregularities in Florida, such as the now infamous “butterfly” ballot and mishandled absentee ballots, some also noted that this election marked only the fourth time in history that the candidate with a plurality of the popular vote did not also win the Electoral College. This “anti-democratic” outcome has fueled desire for reform or even outright elimination of the electoral college. We show that after appropriate statistical analysis of the available historical electoral data, there is little basis to argue for reforming the Electoral College. We first show that while the Electoral College may once have been biased against the Democrats, the current distribution of voters advantages neither party. Further, the electoral vote will differ from the popular vote only when the average vote shares of the two major candidates are extremely close to 50 percent. As for individual voting power, we show that while there has been much temporal variation in relative voting power over the last several decades, the voting power of individual citizens would not likely increase under a popular vote system of electing the president. - Gary King. 1990. "Electoral Responsiveness and Partisan Bias in Multiparty Democracies." Legislative Studies Quarterly, XV, Pp. 159–181.Article
+ Abstract
Because the goals of local and national representation are inherently incompatible, there is an uncertain relationship between aggregates of citizen votes and the national allocation of legislative seats in almost all democracies. In particular electoral systems, this uncertainty leads to diverse configurations of electoral responsiveness and partisian bias, two fundamental concepts in empirical democratic theory. This paper unifies virtually all existing multiyear seats-votes models as special cases of a new general model. It also permits the first formalization of, and reliable method for empirically estimating, electoral responsiveness and partisian bias in electoral systems with any number of political parties. I apply this model to data from nine democratic countries, revealing clear patterns in responsiveness and bias across different types of electoral rules. - Stephen Ansolabehere, Gary King. 1990. "Measuring the Consequences of Delegate Selection Rules in Presidential Nominations." Journal of Politics, 52, Pp. 609–621.Article
+ Abstract
In this paper, we formalize existing normative criteria used to judge presidential selection contests by modeling the translation of citizen votes in primaries and caucuses into delegates to the national party conventions. We use a statistical model that enables us to separate the form of electoral responsiveness in presidential selection systems, as well as the degree of bias toward each of the candidates. We find that (1) the Republican nomination system is more responsive to changes in citizen votes than the Democratic system and (2) non-PR primaries are always more responsive than PR primaries and (3) surprisingly, caucuses are more proportional than even primaries held under PR rules and (4) significant bias in favor of a candidate was a good prediction of the winner of the nomination contest. We also (5) evaluate the claims of Ronald Reagan in 1976 and Jesse Jackson in 1988 that the selection systems were substantially biased against their candidates. We find no evidence to support Reagan’s claim, but substantial evidence that Jackson was correct.
Replication data at the Harvard Dataverse: https://doi.org/10.7910/DVN/AJL7ZZ.
Software
- Andrew Gelman, Gary King, Andrew Thomas. 2010. "JudgeIt II: A Program for Evaluating Electoral Systems and Redistricting Plans."
+ Abstract
A program for analyzing most any feature of district-level legislative elections data, including prediction, evaluating redistricting plans, estimating counterfactual hypotheses (such as what would happen if a term-limitation amendment were imposed), and others. This implements statistical procedures described in a series of journal articles and has been used during redistricting in many states by judges, partisans, governments, private citizens, and many others. Winner of the APSA Research Software Award.
Data
- Gary King, Bradley Palmquist. 1998. "The Record of American Democracy, 1984-1990." Sociological Methods and Research, 26, Pp. 424–427.
Mortality Studies 🔗
Methods for forecasting mortality rates (overall or for time series data cross-classified by age, sex, country, and cause); estimating mortality rates in areas without vital registration; measuring inequality in risk of death; applications to US mortality, the future of the Social Security, armed conflict, heart failure, and human security.
Mortality Studies
- Zachary J. Ward, Rifat Atun, Gary King, Brenda Sequeira Dmello, Sue J. Goldie. 2025. "Assessing Differences in Country-Level Estimates of Maternal Mortality: A Comparison of GMatH, UN, and GBD Model Results for 2020." EClinicalMedicine, 88, Pp. 1-10.Article
+ Abstract
Background. Estimates of maternal mortality are important for informing policy and resource allocation, both globally and for individual countries, and to track progress towards Sustainable Development Goals. The Global Maternal Health (GMatH) model was developed for policy analysis and produces global and country-level estimates of maternal mortality. Estimates are also produced by models from the United Nations (UN) and Global Burden of Disease (GBD).
Methods. We compared country-level estimates for 2020 of maternal deaths and the maternal mortality ratio (MMR) across the UN (v2023), GBD (v2021), and GMatH (v2023) models. We summarized the differences, assessed model convergence, and characterized the available empirical mortality data for countries with large differences to shed light on potential reasons for these differences.
Findings. On average, the GMatH estimates of country-level maternal deaths in 2020 were 272 larger (43% higher) than the UN estimates, and 728 larger (49% higher) than the GBD estimates. Country-level MMRs were on average 22.3 higher (19% higher) than the UN estimates and 48.1 higher (22% higher) than the GBD estimates. Overall, 87.9% of the UN country-level MMR estimates were convergent with the GMatH model, and 82.8% of the GBD MMR estimates were convergent, but large differences were found for some countries. Among countries with the largest differences across models, survey-based estimates of the pregnancy mortality ratio were usually the only empirical mortality data available.
Interpretation. Although estimates of maternal mortality are similar across the GMatH, UN, and GBD models for most countries, there are also large differences. Our structural modelling approach leverages multiple types of data across the reproductive life course, including pregnancy mortality ratios, allowing for more robust estimation of maternal health indicators. Comparing results across models helps to build confidence in estimates where they are similar and sheds light on potential reasons for differences where they diverge to help refine estimates and guide policies to reduce maternal mortality.
- Zachary J. Ward, Rifat Atun, Gary King, Brenda Sequeira Dmello, Sue J. Goldie. 2024. "Global Maternal Mortality Projections by Urban Rural Locationand Education Level: A Simulation-Based Analysis." EClinicalMedicine, 72, Pp. 1-12.Article
+ Abstract
Background
Maternal mortality remains a challenge in global health, with well-known disparities across countries. However, less is known about disparities in maternal health by subgroups within countries. The aim of this study is to estimate maternal health indicators for subgroups of women within each country.
Methods
In this simulation-based analysis, we used the empirically calibrated Global Maternal Health (GMatH) microsimulation model to estimate a range of maternal health indicators by subgroup (urban/rural location and level of education) for 200 countries/territories from 1990 to 2050. Education levels were defined as low (less than primary), middle (less than secondary), and high (completed secondary or higher). The model simulates the reproductive lifecycle of each woman, accounting for individual-level factors such as family planning preferences, biological factors (e.g., anemia), and history of maternal complications, and how these factors vary by subgroup. We also estimated the impact of scaling up women’s education on projected maternal health outcomes compared to clinical and health system-focused interventions.
Findings
We find large subgroup differences in maternal health outcomes, with an estimated global maternal mortality ratio (MMR) in 2022 of 292 (95% UI 250–341) for rural women and 100 (95% UI 84–116) for urban women, and 536 (95% UI 450–594), 143 (95% UI 117–174), and 85 (95% UI 67–108) for low, middle, and high education levels, respectively. Ensuring all women complete secondary school is associated with a large impact on the projected global MMR in 2030 (97 [95% UI 76–120]) compared to current trends (167 [95% UI 142–188]), with especially large improvements in countries such as Afghanistan, Chad, Madagascar, Niger, and Yemen.
Interpretation
Substantial subgroup disparities present a challenge for global maternal health and health equity. Outcomes are especially poor for rural women with low education, highlighting the need to ensure that policy interventions adequately address barriers to care in rural areas, and the importance of investing in social determinants of health, such as women’s education, in addition to health system interventions to improve maternal health for all women.
- Zachary J. Ward, Rifat Atun, Gary King, Brenda Sequeira Dmello, Sue J. Goldie. 2024. "Global Maternal Health Country Typologies: A Framework to Guide Policy." PLOS Global Public Health, 4, 11, Pp. e0003867.Article
+ Abstract
Maternal mortality remains a large challenge in global health. Learning from the experience of similar countries can help to accelerate progress. In this analysis we develop a typology of country groupings for maternal health and provide guidance on how policy implications vary by country typology. We used estimates from the Global Maternal Health (GMatH) microsimulation model, which was empirically calibrated to a range of fertility, process, and mortality indicators and provides estimates for 200 countries and territories. We used the 2022 estimates of the maternal mortality ratio (MMR) and lifetime risk of maternal death (LTR) and used a k-means clustering algorithm to define groups of countries based on these indicators. We estimated the means of other maternal indicators for each group, as well as the mean impact of different policy interventions. We identified 7 groups (A-G) of country typologies with different salient features. High burden countries (A-B) generally have MMRs above 500 and LTRs above 2%, and account for nearly 25% of global maternal deaths. Countries in these groups are estimated to benefit most from improving access to family planning and increasing facility births. Middle burden countries (C-E) generally have MMRs between 100–500 and LTRs between 0.5%-3%. Countries in these groups account for 55% of global maternal deaths and would benefit most from increasing facility births and improving quality of care. Low burden countries (F-G) generally have MMRs below 100 and LTRs below 0.5%, account for 20% of global maternal deaths, and would benefit most from improving access to family planning and community-based interventions and linkages to care. Indicators vary widely across groups, but also within groups, highlighting the importance of considering multiple indicators when assessing progress in maternal health. Policy impacts also differ by country typology, providing policymakers with information to help prioritize interventions. - Zachary J. Ward, Rifat Atun, Gary King, Brenda Sequeira Dmello, Sue J. Goldie. 2023. "A Simulation-Based Comparative Effectiveness Analysis of Policies to Improve Global Maternal Health Outcomes." Nature Medicine, 29, 5, Pp. 1262–1272.Article Publisher's Version
+ Abstract
The Sustainable Development Goals include a target to reduce the global maternal mortality ratio (MMR) to less than 70 maternal deaths per 100,000 live births by 2030, with no individual country exceeding 140. However, on current trends the goals are unlikely to be met. We used the empirically calibrated Global Maternal Health microsimulation model, which simulates individual women in 200 countries and territories to evaluate the impact of different interventions and strategies from 2022 to 2030. Although individual interventions yielded fairly small reductions in maternal mortality, integrated strategies were more effective. A strategy to simultaneously increase facility births, improve the availability of clinical services and quality of care at facilities, and improve linkages to care would yield a projected global MMR of 72 (95% uncertainty interval (UI) = 58–87) in 2030. A comprehensive strategy adding family planning and community-based interventions would have an even larger impact, with a projected MMR of 58 (95% UI = 46–70). Although integrated strategies consisting of multiple interventions will probably be needed to achieve substantial reductions in maternal mortality, the relative priority of different interventions varies by setting. Our regional and country-level estimates can help guide priority setting in specific contexts to accelerate improvements in maternal health. - Zachary J. Ward, Rifat Atun, Gary King, Brenda Sequeira Dmello, Sue J. Goldie. 2023. "Simulation-Based Estimates and Projections of Global, Regional and Country-Level Maternal Mortality by Cause, 1990–2050." Nature Medicine, 29, 5, Pp. 1253–1261.Article Publisher's Version
+ Abstract
Maternal mortality is a major global health challenge. Although progress has been made globally in reducing maternal deaths, measurement remains challenging given the many causes and frequent underreporting of maternal deaths. We developed the Global Maternal Health microsimulation model for women in 200 countries and territories, accounting for individual fertility preferences and clinical histories. Demographic, epidemiologic, clinical and health system data were synthesized from multiple sources, including the medical literature, Civil Registration Vital Statistics systems and Demographic and Health Survey data. We calibrated the model to empirical data from 1990 to 2015 and assessed the predictive accuracy of our model using indicators from 2016 to 2020. We projected maternal health indicators from 1990 to 2050 for each country and estimate that between 1990 and 2020 annual global maternal deaths declined by over 40% from 587,500 (95% uncertainty intervals (UI) 520,600–714,000) to 337,600 (95% UI 307,900–364,100), and are projected to decrease to 327,400 (95% UI 287,800–360,700) in 2030 and 320,200 (95% UI 267,100–374,600) in 2050. The global maternal mortality ratio is projected to decline to 167 (95% UI 142–188) in 2030, with 58 countries above 140, suggesting that on current trends, maternal mortality Sustainable Development Goal targets are unlikely to be met. Building on the development of our structural model, future research can identify context-specific policy interventions that could allow countries to accelerate reductions in maternal deaths. - Rockli Kim, Avleen S. Bijral, Yun Xu, Xiuyuan Zhang, Jeffrey C. Blossom, Akshay Swaminathan, Gary King, Alok Kumar, Rakesh Sarwal, Juan M. Lavista Ferres, S.V. Subramanian. 2021. "Precision Mapping Child Undernutrition for Nearly 600,000 Inhabited Census Villages in India." Proceedings of the National Academy of Sciences, 118, 18, Pp. e2025865118.Article Publisher's Version
+ Abstract
There are emerging opportunities to assess health indicators at truly small areas with increasing availability of data geocoded to micro geographic units and advanced modeling techniques. The utility of such fine-grained data can be fully leveraged if linked to local governance units that are accountable for implementation of programs and interventions. We used data from the 2011 Indian Census for village-level demographic and amenities features and the 2016 Indian Demographic and Health Survey in a bias-corrected semisupervised regression framework to predict child anthropometric failures for all villages in India. Of the total geographic variation in predicted child anthropometric failure estimates, 54.2 to 72.3% were attributed to the village level followed by 20.6 to 39.5% to the state level. The mean predicted stunting was 37.9% (SD: 10.1%; IQR: 31.2 to 44.7%), and substantial variation was found across villages ranging from less than 5% for 691 villages to over 70% in 453 villages. Estimates at the village level can potentially shift the paradigm of policy discussion in India by enabling more informed prioritization and precise targeting. The proposed methodology can be adapted and applied to diverse population health indicators, and in other contexts, to reveal spatial heterogeneity at a finer geographic scale and identify local areas with the greatest needs and with direct implications for actions to take place. - Stefan Wojcik, Avleen Bijral, Richard Johnston, Juan Miguel Lavista, Gary King, Ryan Kennedy, Alessandro Vespignani, David Lazer. 2021. "Survey Data and Human Computation for Improved Flu Tracking." Nature Communications, 12, 1, Pp. 194.Article Publisher's Version Appendix
+ Abstract
While digital trace data from sources like search engines hold enormous potential for tracking and understanding human behavior, these streams of data lack information about the actual experiences of those individuals generating the data. Moreover, most current methods ignore or under-utilize human processing capabilities that allow humans to solve problems not yet solvable by computers (human computation). We demonstrate how behavioral research, linking digital and real-world behavior, along with human computation, can be utilized to improve the performance of studies using digital data streams. This study looks at the use of search data to track prevalence of Influenza-Like Illness (ILI). We build a behavioral model of flu search based on survey data linked to users’ online browsing data. We then utilize human computation for classifying search strings. Leveraging these resources, we construct a tracking model of ILI prevalence that outperforms strong historical benchmarks using only a limited stream of search data and lends itself to tracking ILI in smaller geographic units. While this paper only addresses searches related to ILI, the method we describe has potential for tracking a broad set of phenomena in near real-time. - Eran Segal, Feng Zhang, Xihong Lin, Gary King, Ophir Shalem, Smadar Shilo, William E. Allen, Yonatan H. Grad, Casey S. Greene, Faisal Alquaddoomi, Simon Anders, Ran Balicer, Tal Bauman, Ximena Bonilla, Gisel Booman, Andrew T. Chan, Ori Cohen, Silvano Coletti, Natalie Davidson, Yuval Dor, David A. Drew, Olivier Elemento, Georgina Evans, Phil Ewels, Joshua Gale, Amir Gavrieli, Benjamin Geiger, Iman Hajirasouliha, Roman Jerala, Andre Kahles, Olli Kallioniemi, Ayya Keshet, Gregory Landua, Tomer Meir, Aline Muller, Long H. Nguyen, Matej Oresic, Svetlana Ovchinnikova, Hedi Peterson, Jay Rajagopal, Gunnar Rätsch, Hagai Rossman, Johan Rung, Andrea Sboner, Alexandros Sigaras, Tim Spector, Ron Steinherz, Irene Stevens, Jaak Vilo, Paul Wilmes, CCC (Coronavirus Census Collective). 2020. "Building an International Consortium for Tracking Coronavirus Health Status." Nature Medicine, 26, Pp. 1161-65.Article Publisher's Version
+ Abstract
Information is the most potent protective weapon we have to combat a pandemic, at both the individual and global level. For individuals, information can help us make personal decisions and provide a sense of security. For the global community, information can inform policy decisions and offer critical insights into the epidemic of COVID-19 disease. Fully leveraging the power of information, however, requires large amounts of data and access to it. To achieve this, we are making steps to form an international consortium, Coronavirus Census Collective (CCC, coronaviruscensuscollective.org), that will serve as a hub for integrating information from multiple data sources that can be utilized to understand, monitor, predict, and combat global pandemics. These sources may include self-reported health status through surveys (including mobile apps), results of diagnostic laboratory tests, and other static and real-time geospatial data. This collective effort to track and share information will be invaluable in predicting hotspots of disease outbreak, identifying which factors control the rate of spreading, informing immediate policy decisions, evaluating the effectiveness of measures taken by health organizations on pandemic control, and providing critical insight on the etiology of COVID-19. It will also help individuals stay informed on this rapidly evolving situation and contribute to other global efforts to slow the spread of disease. In the past few weeks, several initiatives across the globe have surfaced to use daily self-reported symptoms as a means to track disease spread, predict outbreak locations, guide population measures and help in the allocation of healthcare resources. The aim of this paper is to put out a call to standardize these efforts and spark a collaborative effort to maximize the global gain while protecting participant privacy. - Soubhik Barari, Stefano Caria, Antonio Davola, Paolo Falco, Thiemo Fetzer, Stefano Fiorin, Lukas Hensel, Andriy Ivchenko, Jon Jachimowicz, Gary King, Gordon Kraft-Todd, Alice Ledda, Mary MacLennan, Lucian Mutoi, Claudio Pagani, Elena Reutskaja, Christopher Roth, Federico Raimondi Slepoi. 2020. "Evaluating COVID-19 Public Health Messaging in Italy: Self-Reported Compliance and Growing Mental Health Concerns."Article
+ Abstract
Purpose: The COVID-19 death-rate in Italy continues to climb, surpassing that in every other country. We implement one of the first nationally representative surveys about this unprecedented public health crisis and use it to evaluate the Italian government’ public health efforts and citizen responses. Findings: (1) Public health messaging is being heard. Except for slightly lower compliance among young adults, all subgroups we studied understand how to keep themselves and others safe from the SARS-Cov-2 virus. Remarkably, even those who do not trust the government, or think the government has been untruthful about the crisis believe the messaging and claim to be acting in accordance. (2) The quarantine is beginning to have serious negative effects on the population’s mental health. Policy Recommendations: Communications focus should move from explaining to citizens that they should stay at home to what they can do there. We need interventions that make staying at home and following public health protocols more desirable. These interventions could include virtual social interactions, such as online social reading activities, classes, exercise routines, etc. — all designed to reduce the boredom of long term social isolation and to increase the attractiveness of following public health recommendations. Interventions like these will grow in importance as the crisis wears on around the world, and staying inside wears on people.
Replication data at the Harvard Dataverse: https://doi.org/10.7910/DVN/1SBQCX.
- William E. Allen, Han Altae-Tran, James Briggs, Xin Jin, Glen McGee, Andy Shi, Rumya Raghavan, Mireille Kamariza, Nicole Nova, Albert Pereta, Chris Danford, Amine Kamel, Patrik Gothe, Evrhet Milam, Jean Aurambault, Thorben Primke, Weijie Li, Josh Inkenbrandt, Tuan Huynh, Evan Chen, Christina Lee, Michael Croatto, Helen Bentley, Wendy Lu, Robert Murray, Mark Travassos, Brent A. Coull, John Openshaw, Casey S. Greene, Ophir Shalem, Gary King, Ryan Probasco, David R. Cheng, Ben Silbermann, Feng Zhang, Xihong Lin. 2020. "Population-Scale Longitudinal Mapping of COVID-19 Symptoms, Behaviour and Testing." Nature Human Behaviour, 4, 9, Pp. 972–982.Article Publisher's Version
+ Abstract
Despite the widespread implementation of public health measures, coronavirus disease 2019 (COVID-19) continues to spread in the United States. To facilitate an agile response to the pandemic, we developed How We Feel, a web and mobile application that collects longitudinal self-reported survey responses on health, behaviour and demographics. Here, we report results from over 500,000 users in the United States from 2 April 2020 to 12 May 2020. We show that self-reported surveys can be used to build predictive models to identify likely COVID-19-positive individuals. We find evidence among our users for asymptomatic or presymptomatic presentation; show a variety of exposure, occupational and demographic risk factors for COVID-19 beyond symptoms; reveal factors for which users have been SARS-CoV-2 PCR tested; and highlight the temporal dynamics of symptoms and self-isolation behaviour. These results highlight the utility of collecting a diverse set of symptomatic, demographic, exposure and behavioural self-reported data to fight the COVID-19 pandemic.
Forecasting Mortality
- Samir Soneji, Gary King. 2012. "Statistical Security for Social Security." Demography, 49, 3, Pp. 1037–1060.Article Publisher's Version Replication Data Replication Data
+ Abstract
The financial viability of Social Security, the single largest U.S. Government program, depends on accurate forecasts of the solvency of its intergenerational trust fund. We begin by detailing information necessary for replicating the Social Security Administration’s (SSA’s) forecasting procedures, which until now has been unavailable in the public domain. We then offer a way to improve the quality of these procedures due to age-and sex-specific mortality forecasts. The most recent SSA mortality forecasts were based on the best available technology at the time, which was a combination of linear extrapolation and qualitative judgments. Unfortunately, linear extrapolation excludes known risk factors and is inconsistent with long-standing demographic patterns such as the smoothness of age profiles. Modern statistical methods typically outperform even the best qualitative judgments in these contexts. We show how to use such methods here, enabling researchers to forecast using far more information, such as the known risk factors of smoking and obesity and known demographic patterns. Including this extra information makes a sub¬stantial difference: For example, by only improving mortality forecasting methods, we predict three fewer years of net surplus, $730 billion less in Social Security trust funds, and program costs that are 0.66% greater of projected taxable payroll compared to SSA projections by 2031. More important than specific numerical estimates are the advantages of transparency, replicability, reduction of uncertainty, and what may be the resulting lower vulnerability to the politicization of program forecasts. In addition, by offering with this paper software and detailed replication information, we hope to marshal the efforts of the research community to include ever more informative inputs and to continue to reduce the uncertainties in Social Security forecasts.
This work builds on our article that provides forecasts of US Mortality rates (see King and Soneji, The Future of Death in America), a book developing improved methods for forecasting mortality (Girosi and King, Demographic Forecasting), all data we used (King and Soneji, replication data sets), and open source software that implements the methods (Girosi and King, YourCast). Also available is a New York Times Op-Ed based on this work (King and Soneji, Social Security: It’s Worse Than You Think), and a replication data set for the Op-Ed (King and Soneji, replication data set).
- Gary King, Samir Soneji. 2011. "The Future of Death in America." Demographic Research, 25, Pp. 1–38.Article DOI
+ Abstract
Population mortality forecasts are widely used for allocating public health expenditures, setting research priorities, and evaluating the viability of public pensions, private pensions, and health care financing systems. In part because existing methods seem to forecast worse when based on more information, most forecasts are still based on simple linear extrapolations that ignore known biological risk factors and other prior information. We adapt a Bayesian hierarchical forecasting model capable of including more known health and demographic information than has previously been possible. This leads to the first age- and sex-specific forecasts of American mortality that simultaneously incorporate, in a formal statistical model, the effects of the recent rapid increase in obesity, the steady decline in tobacco consumption, and the well known patterns of smooth mortality age profiles and time trends. Formally including new information in forecasts can matter a great deal. For example, we estimate an increase in male life expectancy at birth from 76.2 years in 2010 to 79.9 years in 2030, which is 1.8 years greater than the U.S. Social Security Administration projection and 1.5 years more than U.S. Census projection. For females, we estimate more modest gains in life expectancy at birth over the next twenty years from 80.5 years to 81.9 years, which is virtually identical to the Social Security Administration projection and 2.0 years less than U.S. Census projections. We show that these patterns are also likely to greatly affect the aging American population structure. We offer an easy-to-use approach so that researchers can include other sources of information and potentially improve on our forecasts too.
Replication data at the Harvard Dataverse: https://doi.org/10.7910/DVN/IEANXM.
- Federico Girosi, Gary King. 2008. "Demographic Forecasting." Princeton University Press, Princeton.Publisher's Site Errata Dataverse YourCast Software
+ Abstract
We introduce a new framework for forecasting age-sex-country-cause-specific mortality rates that incorporates considerably more information, and thus has the potential to forecast much better, than any existing approach. Mortality forecasts are used in a wide variety of academic fields, and for global and national health policy making, medical and pharmaceutical research, and social security and retirement planning. As it turns out, the tools we developed in pursuit of this goal also have broader statistical implications, in addition to their use for forecasting mortality or other variables with similar statistical properties. First, our methods make it possible to include different explanatory variables in a time series regression for each cross-section, while still borrowing strength from one regression to improve the estimation of all. Second, we show that many existing Bayesian (hierarchical and spatial) models with explanatory variables use prior densities that incorrectly formalize prior knowledge. Many demographers and public health researchers have fortuitously avoided this problem so prevalent in other fields by using prior knowledge only as an ex post check on empirical results, but this approach excludes considerable information from their models. We show how to incorporate this demographic knowledge into a model in a statistically appropriate way. Finally, we develop a set of tools useful for developing models with Bayesian priors in the presence of partial prior ignorance. This approach also provides many of the attractive features claimed by the empirical Bayes approach, but fully within the standard Bayesian theory of inference. - Federico Girosi, Gary King. 2007. "Understanding the Lee-Carter Mortality Forecasting Method."Article
+ Abstract
We demonstrate here several previously unrecognized or insufficiently appreciated properties of the Lee-Carter mortality forecasting approach, the dominant method used in both the academic literature and practical applications. We show that this model is a special case of a considerably simpler, and less often biased, random walk with drift model, and prove that the age profile forecast from both approaches will always become less smooth and unrealistic after a point (when forecasting forward or backwards in time) and will eventually deviate from any given baseline. We use these and other properties we demonstrate to suggest when the model would be most applicable in practice.
Estimating Overall and Cause-Specific Mortality Rates
- Zachary J. Ward, Rifat Atun, Gary King, Brenda Sequeira Dmello, Sue J. Goldie. 2024. "Global Maternal Mortality Projections by Urban Rural Locationand Education Level: A Simulation-Based Analysis." EClinicalMedicine, 72, Pp. 1-12.Article
+ Abstract
Background
Maternal mortality remains a challenge in global health, with well-known disparities across countries. However, less is known about disparities in maternal health by subgroups within countries. The aim of this study is to estimate maternal health indicators for subgroups of women within each country.
Methods
In this simulation-based analysis, we used the empirically calibrated Global Maternal Health (GMatH) microsimulation model to estimate a range of maternal health indicators by subgroup (urban/rural location and level of education) for 200 countries/territories from 1990 to 2050. Education levels were defined as low (less than primary), middle (less than secondary), and high (completed secondary or higher). The model simulates the reproductive lifecycle of each woman, accounting for individual-level factors such as family planning preferences, biological factors (e.g., anemia), and history of maternal complications, and how these factors vary by subgroup. We also estimated the impact of scaling up women’s education on projected maternal health outcomes compared to clinical and health system-focused interventions.
Findings
We find large subgroup differences in maternal health outcomes, with an estimated global maternal mortality ratio (MMR) in 2022 of 292 (95% UI 250–341) for rural women and 100 (95% UI 84–116) for urban women, and 536 (95% UI 450–594), 143 (95% UI 117–174), and 85 (95% UI 67–108) for low, middle, and high education levels, respectively. Ensuring all women complete secondary school is associated with a large impact on the projected global MMR in 2030 (97 [95% UI 76–120]) compared to current trends (167 [95% UI 142–188]), with especially large improvements in countries such as Afghanistan, Chad, Madagascar, Niger, and Yemen.
Interpretation
Substantial subgroup disparities present a challenge for global maternal health and health equity. Outcomes are especially poor for rural women with low education, highlighting the need to ensure that policy interventions adequately address barriers to care in rural areas, and the importance of investing in social determinants of health, such as women’s education, in addition to health system interventions to improve maternal health for all women.
Uses of Mortality Rates
- Konstantin Kashin, Gary King, Samir Soneji. 2015. "Explaining Systematic Bias and Nontransparency in US Social Security Administration Forecasts." Political Analysis, 23, 3, Pp. 336–362.Article Publisher's Version
+ Abstract
The accuracy of U.S. Social Security Administration (SSA) demographic and financial forecasts is crucial for the solvency of its Trust Funds, government programs comprising greater than 50% of all federal government expenditures, industry decision making, and the evidence base of many scholarly articles. Forecasts are also essential for scoring policy proposals put forward by both political parties or anyone else. Because SSA makes public little replication information, and uses ad hoc, qualitative, and antiquated statistical forecasting methods, no one in or out of government has been able to produce fully independent alternative forecasts or policy scorings. Yet, no systematic evaluation of SSA forecasts has ever been published by SSA or anyone else. We show that SSA’s forecasting errors were approximately unbiased until about 2000, but then began to grow quickly, with increasingly overconfident uncertainty intervals. Moreover, the errors all turn out to be in the same potentially dangerous direction, each making the Social Security Trust Funds look healthier than they actually are. We also discover the cause of these findings with evidence from a large number of interviews we conducted with participants at every level of the forecasting and policy processes. We show that SSA’s forecasting procedures meet all the conditions the modern social-psychology and statistical literatures demonstrate make bias likely. When those conditions mixed with potent new political forces trying to change Social Security and influence the forecasts, SSA’s actuaries hunkered down trying hard to insulate themselves from the intense political pressures. Unfortunately, this otherwise laudable resistance to undue influence, along with their ad hoc qualitative forecasting models, led them to also miss important changes in the input data, such as retirees living longer lives, and drawing more benefits, than predicted by their simple extrapolations. We explain that solving this problem involves using (a) removing human judgment where possible, by using modern statistical methods – via the revolution in data science and big data; (b) instituting formal structural procedures when human judgment is required – via the revolution in social psychological research; and (c) requiring transparency and data sharing to catch errors that slip through – via the revolution in data sharing & replication. This talk is based on publications available at the Evaluating Social Security Forecasts project. - Konstantin Kashin, Gary King, Samir Soneji. 2015. "Systematic Bias and Nontransparency in US Social Security Administration Forecasts." Journal of Economic Perspectives, 29, 2, Pp. 239–258.Article Publisher's Version
+ Abstract
The financial stability of four of the five largest U.S. federal entitlement programs, strategic decision making in several industries, and many academic publications all depend on the accuracy of demographic and financial forecasts made by the Social Security Administration (SSA). Although the SSA has performed these forecasts since 1942, no systematic and comprehensive evaluation of their accuracy has ever been published by SSA or anyone else. The absence of a systematic evaluation of forecasts is a concern because the SSA relies on informal procedures that are potentially subject to inadvertent biases and does not share with the public, the scientific community, or other parts of SSA sufficient data or information necessary to replicate or improve its forecasts. These issues result in SSA holding a monopoly position in policy debates as the sole supplier of fully independent forecasts and evaluations of proposals to change Social Security. To assist with the forecasting evaluation problem, we collect all SSA forecasts for years that have passed and discover error patterns that could have been—and could now be—used to improve future forecasts. Specifically, we find that after 2000, SSA forecasting errors grew considerably larger and most of these errors made the Social Security Trust Funds look more financially secure than they actually were. In addition, SSA’s reported uncertainty intervals are overconfident and increasingly so after 2000. We discuss the implications of these systematic forecasting biases for public policy.
Replication data at the Harvard Dataverse: https://doi.org/10.7910/DVN/28122.
- Samir Soneji, Gary King. 2012. "Statistical Security for Social Security." Demography, 49, 3, Pp. 1037–1060.Article Publisher's Version Replication Data Replication Data
+ Abstract
The financial viability of Social Security, the single largest U.S. Government program, depends on accurate forecasts of the solvency of its intergenerational trust fund. We begin by detailing information necessary for replicating the Social Security Administration’s (SSA’s) forecasting procedures, which until now has been unavailable in the public domain. We then offer a way to improve the quality of these procedures due to age-and sex-specific mortality forecasts. The most recent SSA mortality forecasts were based on the best available technology at the time, which was a combination of linear extrapolation and qualitative judgments. Unfortunately, linear extrapolation excludes known risk factors and is inconsistent with long-standing demographic patterns such as the smoothness of age profiles. Modern statistical methods typically outperform even the best qualitative judgments in these contexts. We show how to use such methods here, enabling researchers to forecast using far more information, such as the known risk factors of smoking and obesity and known demographic patterns. Including this extra information makes a sub¬stantial difference: For example, by only improving mortality forecasting methods, we predict three fewer years of net surplus, $730 billion less in Social Security trust funds, and program costs that are 0.66% greater of projected taxable payroll compared to SSA projections by 2031. More important than specific numerical estimates are the advantages of transparency, replicability, reduction of uncertainty, and what may be the resulting lower vulnerability to the politicization of program forecasts. In addition, by offering with this paper software and detailed replication information, we hope to marshal the efforts of the research community to include ever more informative inputs and to continue to reduce the uncertainties in Social Security forecasts.
This work builds on our article that provides forecasts of US Mortality rates (see King and Soneji, The Future of Death in America), a book developing improved methods for forecasting mortality (Girosi and King, Demographic Forecasting), all data we used (King and Soneji, replication data sets), and open source software that implements the methods (Girosi and King, YourCast). Also available is a New York Times Op-Ed based on this work (King and Soneji, Social Security: It’s Worse Than You Think), and a replication data set for the Op-Ed (King and Soneji, replication data set).
- Gary King, Richard Nielsen, Aaron Wells. 2012. "Letter to the Editor on the 'Medicare Health Support Pilot Program' (by McCall and Cromwell)." New England Journal of Medicine, 366, 7, Pp. 666–668.
- Megan Murray, Gary King. 2008. "The Effects of International Monetary Fund Loans on Health Outcomes." PLoS Medicine, 5.Article
+ Abstract
A “Perspective” article that discusses an article by David Stuckler and colleagues showing that, in Eastern European and former Soviet countries, participation in International Monetary Fund economic programs have been associated with higher mortality rates from tuberculosis. - Emmanuela Gakidou, Gary King. 2003. "Determinants of Inequality in Child Survival: Results from 39 Countries." In Health Systems Performance Assessment: Debates, Methods and Empiricism, edited by Christopher J.L. Murray and David B. Evans, Pp. 497-502. Geneva: World Health Organization.Book Chapter
+ Abstract
Few would disagree that health policies and programmes ought to be based on valid, timely and relevant information, focused on those aspects of health development that are in greatest need of improvement. For example, vaccination programmes rely heavily on information on cases and deaths to document needs and to monitor progress on childhood illness and mortality. The same strong information basis is necessary for policies on health inequality. The reduction of health inequality is widely accepted as a key goal for societies, but any policy needs reliable research on the extent and causes of health inequality. Given that child deaths still constitute 19% of all deaths globally and 24% of all deaths in developing countries (1), reducing inequalities in child survival is a good beginning.
The between-group component of total health inequality has been studied extensively by numerous scholars. They have expertly analysed the causes of differences in health status and mortality across population subgroups, defined by income, education, race/ethnicity, country, region, social class, and other group identifiers (2–9).
- Emmanuela Gakidou, Gary King. 2002. "Measuring Total Health Inequality: Adding Individual Variation to Group-Level Differences." BioMed Central: International Journal for Equity in Health, 1.Article
+ Abstract
Background: Studies have revealed large variations in average health status across social, economic, and other groups. No study exists on the distribution of the risk of ill-health across individuals, either within groups or across all people in a society, and as such a crucial piece of total health inequality has been overlooked. Some of the reason for this neglect has been that the risk of death, which forms the basis for most measures, is impossible to observe directly and difficult to estimate. Methods: We develop a measure of total health inequality – encompassing all inequalities among people in a society, including variation between and within groups – by adapting a beta-binomial regression model. We apply it to children under age two in 50 low- and middle-income countries. Our method has been adopted by the World Health Organization and is being implemented in surveys around the world and preliminary estimates have appeared in the World Health Report (2000). Results: Countries with similar average child mortality differ considerably in total health inequality. Liberia and Mozambique have the largest inequalities in child survival, while Colombia, the Philippines and Kazakhstan have the lowest levels among the countries measured. Conclusions: Total health inequality estimates should be routinely reported alongside average levels of health in populations and groups, as they reveal important policy-related information not otherwise knowable. This approach enables meaningful comparisons of inequality across countries and future analyses of the determinants of inequality. - Gary King, Christopher J.L. Murray. 2002. "Rethinking Human Security." Political Science Quarterly, 116, Pp. 585–610.Article
+ Abstract
In the last two decades, the international community has begun to conclude that attempts to ensure the territorial security of nation-states through military power have failed to improve the human condition. Despite astronomical levels of military spending, deaths due to military conflict have not declined. Moreover, even when the borders of some states are secure from foreign threats, the people within those states do not necessarily have freedom from crime, enough food, proper health care, education, or political freedom. In response to these developments, the international community has gradually moved to combine economic development with military security and other basic human rights to form a new concept of “human security”. Unfortunately, by common assent the concept lacks both a clear definition, consistent with the aims of the international community, and any agreed upon measure of it. In this paper, we propose a simple, rigorous, and measurable definition of human security: the expected number of years of future life spent outside the state of “generalized poverty”. Generalized poverty occurs when an individual falls below the threshold in any key domain of human well-being. We consider improvements in data collection and methods of forecasting that are necessary to measure human security and then introduce an agenda for research and action to enhance human security that follows logically in the areas of risk assessment, prevention, protection, and compensation.
Teaching and Administration 🔗
Publications and other projects designed to improve teaching, learning, and university administration, as well as broader writings on the future of the social sciences.
- James Evans, Casey Petroff, Gary King. 2026. "Advancing science by designing for surprise." Science, 393(6808), eaej4257. DOI: 10.1126/science.aej4257.Article Publisher's Version
+ Abstract
Consider a thought experiment. Two graduate students have written identical dissertations: the same experiments, the same data, the same robust findings. One is written as a standard, cautious text that flatters the subfield whose intuitions drove the design and to whom the findings will feel familiar. The other reframes the study for a different, but equally relevant, audience—one holding different suppositions and therefore open to being surprised into shifting its position. The latter approach is more valuable for good reasons: the scientific community and the world will learn more.
The job of a scientist is to explain and predict the world, and a vital part of this objective is to deliver knowledge in a way that updates the understandings and expectations of the largest audience. However, scientists have long treated “framing” as a secondary art form. Students are advised to do rigorous empirical work, sprinkled with creative brilliance for which there is neither definition nor strict formula. But what if audiences’ expectations and understandings could be measured and used to guide what scientists choose to study, what conclusions they draw from the evidence, and how they frame findings for distribution? What if the framing and choice of audience are adjustable parameters of a new, broader theory of inference? The question grows particularly urgent as literature becomes flooded with machine-produced papers written by no one, for no one. …
- Natalie Ayers, Gary King, Zagreb Mukerjee, Dominic Skinnion. 2025. "Statistical Intuition Without Coding (or Teachers)." PS: Political Science & Politics, 58, 4, Pp. 730–736.Article Publisher's Version
+ Abstract
Two features of quantitative political methodology make teaching and learning especially difficult: (1) Each new concept in probability, statistics, and inference builds on all previous (and sometimes all other relevant) concepts; and (2) motivating substantively oriented students, by teaching these abstract theories simultaneously with the practical details of a statistical programming language (such as R), makes learning each subject harder. We address both problems through a new type of automated teaching tool that helps students see the big theoretical picture and all its separate parts at the same time without having to simultaneously learn to program. This tool, which we make available via one click in a web browser, can be used in a traditional methods class, but is also designed to work without instructor supervision. - Jonathan Katz, Gary King, Elizabeth Rosenblatt. 2022. "Rejoinder: Concluding Remarks on Scholarly Communications." Political Analysis, 31, 3, Pp. 335–336.Article Publisher's Version
+ Abstract
We are grateful to DeFord et al. for the continued attention to our work and the crucial issues of fair representation in democratic electoral systems. Our response (Katz, King, and Rosenblatt, forthcoming) was designed to help readers avoid being misled by mistaken claims in DeFord et al. (forthcoming-a), and does not address other literature or uses of our prior work. As it happens, none of our corrections were addressed (or contradicted) in the most recent submission (DeFord et al., forthcoming-b).
We also offer a recommendation regarding DeFord et al.’s (forthcoming-b) concern with how expert witnesses, consultants, and commentators should present academic scholarship to academic novices, such as judges, public officials, the media, and the general public. In these public service roles, scholars attempt to translate academic understanding of sophisticated scholarly literatures, technical methodologies, and complex theories for those without sufficient background in social science or statistics.
- Gary King. 2021. "Education and Scholarship by Video."Publisher's Version
+ Abstract
When word processors were first introduced into the workplace, they turned scholars into typists. But they also improved our work: Turnaround time for new drafts dropped from days to seconds. Rewriting became easier and more common, and our papers, educational efforts, and research output improved. I discuss the advantages of and mechanisms for doing the same with do-it-yourself video recordings of research talks and class lectures, so that they may become a fully respected channel for scholarly output and education, alongside books and articles. I consider innovations in video design to optimize education and communication, along with technology to make this change possible.
Open source methods of implementing the suggested design appear in the paper; to use Camtasia, see this.
Excerpts of this paper appeared in Political Science Today (Vol. 1, No. 3, August 2021: Pp.5-6, copy here) and in APSAEducate. See also my recorded videos here.
- Gary King, Shiro Kuriwaki, Yon Soo Park. 2020. "The 'Math Prefresher' and The Collective Future of Political Science Graduate Training." PS: Political Science & Politics, 53, 3, Pp. 537–541.Article Publisher's Version
+ Abstract
The political science math prefresher arose a quarter century ago and has now spread to many of our discipline’s Ph. D. programs. Incoming students arrive for graduate school a few weeks early for ungraded instruction in math, statistics, and computer science as they are useful for political science. The prefresher’s benefits, however, go beyond the technical material taught: it develops lasting camaraderie with their entering class, facilitates connections with senior graduate students, opens pathways to mastering methods necessary for research, and eases the transition to the increasingly collaborative nature of graduate work. The prefresher also shows how faculty across a highly diverse discipline can work together to train the next generation. We review this program, highlight its collaborative aspects, and try to take the idea to the next level by building infrastructure to share teaching materials across universities so separate programs can build on each other’s work and improve all our programs. - Gary King. 2020. "So You're a Grad Student Now? Maybe You Should Do This." In The SAGE Handbook of Research Methods in Political Science and International Relations, edited by Jr. Robert J. Franzese and Luigi Curini, Pp. 1-4. London: Sage Publications.Book Chapter
+ Abstract
Congratulations! You’ve made it to graduate school. This means you’re in a select group, about to embark on a great adventure to learn about the world and teach us all some new things. This also means you obviously know how to follow rules. So I have five for you – not counting the obvious one that to learn new things you’ll need to break some rules. After all, to be a successful academic, you’ll need to cut a new path, and so if you do exactly what your advisors and I did, you won’t get anywhere near as far since we already did it. So here are some rules, but break some of them, perhaps including this one - Kelly Miller, Brian Lukoff, Gary King, Eric Mazur. 2018. "Use of a Social Annotation Platform for Pre-Class Reading Assignments in a Flipped Introductory Physics Class." Frontiers in Education, 3, Pp. 8.Article Publisher's Version
+ Abstract
In this paper, we illustrate the successful implementation of pre-class reading assignments through a social learning platform that allows students to discuss the reading online with their classmates. We show how the platform can be used to understand how students are reading before class. We find that, with this platform, students spend an above average amount of time reading (compared to that reported in the literature) and that most students complete their reading assignments before class. We identify specific reading behaviors that are predictive of in-class exam performance. We also demonstrate ways that the platform promotes active reading strategies and produces high-quality learning interactions between students outside class. Finally, we compare the exam performance of two cohorts of students, where the only difference between them is the use of the platform; we show that students do significantly better on exams when using the platform.
Reprinted in Cassidy, R., Charles, E. S., Slotta, J. D., Lasry, N., eds. (2019). Active Learning: Theoretical Perspectives, Empirical Studies and Design Profiles. Lausanne: Frontiers Media. doi: 10.3389/978-2-88945-885-1
- Michail Schwab, Hendrik Strobelt, James Tompkin, Colin Fredericks, Connor Huff, Dana Higgins, Anton Strezhnev, Mayya Komisarchik, Gary King, Hanspeter Pfister. 2017. "Booc.Io: An Education System With Hierarchical Concept Maps." IEEE Transactions on Visualization and Computer Graphics, 23, 1, Pp. 571-80.Publisher's Version
+ Abstract
Information hierarchies are difficult to express when real-world space or time constraints force traversing the hierarchy in linear presentations, such as in educational books and classroom courses. We present booc.io, which allows linear and non-linear presentation and navigation of educational concepts and material. To support a breadth of material for each concept, booc.io is Web based, which allows adding material such as lecture slides, book chapters, videos, and LTIs. A visual interface assists the creation of the needed hierarchical structures. The goals of our system were formed in expert interviews, and we explain how our design meets these goals. We adapt a real-world course into booc.io, and perform introductory qualitative evaluation with students. - Gary King, Melissa Sands. 2016. "How Human Subjects Research Rules Mislead You and Your University, and What to Do About It."Article
+ Abstract
Universities require faculty and students planning research involving human subjects to pass formal certification tests and then submit research plans for prior approval. Those who diligently take the tests may better understand certain important legal requirements but, at the same time, are often misled into thinking they can apply these rules to their own work which, in fact, they are not permitted to do. They will also be missing many other legal requirements not mentioned in their training but which govern their behaviors. Finally, the training leaves them likely to completely misunderstand the essentially political situation they find themselves in. The resulting risks to their universities, collaborators, and careers may be catastrophic, in addition to contributing to the more common ordinary frustrations of researchers with the system. To avoid these problems, faculty and students conducting research about and for the public need to understand that they are public figures, to whom different rules apply, ones that political scientists have long studied. University administrators (and faculty in their part-time roles as administrators) need to reorient their perspectives as well. University research compliance bureaucracies have grown, in well-meaning but sometimes unproductive ways that are not required by federal laws or guidelines. We offer advice to faculty and students for how to deal with the system as it exists now, and suggestions for changes in university research compliance bureaucracies, that should benefit faculty, students, staff, university budgets, and our research subjects. - Gary King. 2016. "The C-SPAN Archives As The Policymaking Record of American Representative Democracy: A Foreword." In Exploring the C-SPAN Archives: Advancing the Research Agenda, edited by Robert Browning. West Lafayette, IN: Purdue University Press.Book Chapter
+ Abstract
Almost two centuries ago, the idea of research libraries, and the possibility of building them at scale, began to be realized. Although we can find these libraries at every major college and university in the world today, and at many noneducational research institutions, this outcome was by no means obvious at the time. And the benefits we all now enjoy from their existence were then at best merely vague speculations.
How many would have supported the formation of these institutions at the time, without knowing the benefits that have since become obvious? After all, the arguments against this massive ongoing expenditure are impressive. The proposal was to construct large buildings, hire staff, purchase all manner of books and other publications and catalogue and shelve them, provide access to visitors, and continually reorder all the books that the visitors disorder. And the libraries would keep the books, and fund the whole operation, in perpetuity. Publications would be collected without anyone deciding which were of high quality and thus deserving of preservation—leading critics to argue that all this effort would result in expensive buildings packed mostly with junk. . . .
- Gary King. 2014. "Restructuring the Social Sciences: Reflections from Harvard's Institute for Quantitative Social Science." Political Science and Politics, 47, 1, Pp. 165–172.Article Publisher's Version
+ Abstract
The social sciences are undergoing a dramatic transformation from studying problems to solving them; from making do with a small number of sparse data sets to analyzing increasing quantities of diverse, highly informative data; from isolated scholars toiling away on their own to larger scale, collaborative, interdisciplinary, lab-style research teams; and from a purely academic pursuit to having a major impact on the world. To facilitate these important developments, universities, funding agencies, and governments need to shore up and adapt the infrastructure that supports social science research. We discuss some of these developments here, as well as a new type of organization we created at Harvard to help encourage them – the Institute for Quantitative Social Science. An increasing number of universities are beginning efforts to respond with similar institutions. This paper provides some suggestions for how individual universities might respond and how we might work together to advance social science more generally. - Gary King, Maya Sen. 2013. "How Social Science Research Can Improve Teaching." Political Science and Politics, 46, 3, Pp. 621–629.Article
+ Abstract
We marshal discoveries about human behavior and learning from social science research and show how they can be used to improve teaching and learning. The discoveries are easily stated as three social science generalizations: (1) social connections motivate, (2) teaching teaches the teacher, and (3) instant feedback improves learning. We show how to apply these generalizations via innovations in modern information technology inside, outside, and across university classrooms. We also give concrete examples of these ideas from innovations we have experimented with in our own teaching.
See also a video presentation of this talk before the Harvard Board of Overseers
- Gary King, Maya Sen. 2013. "The Troubled Future of Colleges and Universities (with Comments from Five Scholar-Administrators)." Political Science and Politics, 46, 1, Pp. 83–89.Article
+ Abstract
The American system of higher education is under attack by political, economic, and educational forces that threaten to undermine its business model, governmental support, and operating mission. The potential changes are considerably more dramatic and disruptive than what we’ve already experienced. Traditional colleges and universities urgently need a coherent, thought-out response. Their central role in ensuring the creation, preservation, and distribution of knowledge may be at risk and, as a consequence, so too may be the spectacular progress across fields we have come to expect as a result.
Symposium contributors include Henry E. Brady, John Mark Hansen, Gary King, Nannerl O. Keohane, Michael Laver, Virginia Sapiro, and Maya Sen.
- Gary King. 2011. "Ensuring the Data Rich Future of the Social Sciences." Science, 331, 11 February, Pp. 719-21.Article
+ Abstract
Massive increases in the availability of informative social science data are making dramatic progress possible in analyzing, understanding, and addressing many major societal problems. Yet the same forces pose severe challenges to the scientific infrastructure supporting data sharing, data management, informatics, statistical methodology, and research ethics and policy, and these are collectively holding back progress. I address these changes and challenges and suggest what can be done. - Gary King. 2009. "The Changing Evidence Base of Social Science Research." In The Future of Political Science: 100 Perspectives, edited by Gary King, Kay Schlozman, and Norman Nie. New York: Routledge Press.Book Chapter
+ Abstract
This (two-page) article argues that the evidence base of political science and the related social sciences are beginning an underappreciated but historic change. - Gary King, Kay Schlozman, Norman Nie. 2009. "The Future of Political Science: 100 Perspectives." Routledge Press, New York.Publisher's Site
+ Abstract
This book contains some of the newest, most exciting ideas now percolating among political scientists, from hallway conversations to conference room discussions. To spur future research, enrich classroom teaching, and direct non-specialist attention to cutting-edge ideas, a distinguished group of authors from various parts of this sprawling and pluralistic discipline has each contributed a brief essay about a single novel or insufficiently appreciated idea on some aspect of political science. The one hundred essays are concise, no more than a few pages apiece, and informal. While the contributions are highly diverse, readers can find unexpected connections across the volume, tracing echoes as well as diametrically opposed points of view. This book offers compelling points of departure for everyone who is concerned about political science—whether as a scholar, teacher, student, or interested reader. - Micah Altman, Gary King. 2007. "A Proposed Standard for the Scholarly Citation of Quantitative Data." D-Lib Magazine, 13.Article Publisher's Version
+ Abstract
An essential aspect of science is a community of scholars cooperating and competing in the pursuit of common goals. A critical component of this community is the common language of and the universal standards for scholarly citation, credit attribution, and the location and retrieval of articles and books. We propose a similar universal standard for citing quantitative data that retains the advantages of print citations, adds other components made possible by, and needed due to, the digital form and systematic nature of quantitative data sets, and is consistent with most existing subfield-specific approaches. Although the digital library field includes numerous creative ideas, we limit ourselves to only those elements that appear ready for easy practical use by scientists, journal editors, publishers, librarians, and archivists. - Gary King. 2006. "Publication, Publication." PS: Political Science and Politics, 39, Pp. 119–125.Article
+ Abstract
I show herein how to write a publishable paper by beginning with the replication of a published article. This strategy seems to work well for class projects in producing papers that ultimately get published, helping to professionalize students into the discipline, and teaching them the scientific norms of the free exchange of academic information. I begin by briefly revisiting the prominent debate on replication our discipline had a decade ago and some of the progress made in data sharing since. Best Instructional Innovation in the Social Sciences or Social History, Honorable Mention, ICPSR Prize - Gary King, John Bruce, Michael Gilligan. 1993. "The Science of Political Science Graduate Admissions." PS: Political Science and Politics, XXVI, Pp. 772–778.Article
+ Abstract
As political scientists, we spend much time teaching and doing scholarly research, and more time than we may wish to remember on university committees. However, just as many of us believe that teaching and research are not fundamentally different activities, we also need not use fundamentally different standards of inference when studying government, policy, and politics than when participating in the governance of departments and universities. In this article, we describe our attempts to bring somewhat more systematic methods to the process and policies of graduate admissions. - Gary King, Daniel Walsh. 1993. "Good Research and Bad Research: Extending Zimile's Criticism." Early Childhood Research Quarterly, 8, Pp. 397–401.Article
+ Abstract
Herbert Zimiles has written a provocative article on quantitative research. Because his specific critiques of research on infant day care are nominal examples of his much broader arguments, we focus only on his general methodological perspectives in this brief comment. We write as methodologists, a qualitative researcher with a quantitative background (Walsh) and a quantitative researcher completing a book on qualitative research (King and see King, Keohane & Verba, in preparation).
Papers
Advancing science by designing for surprise
Where's the Evidence that Respondents Understand Your Survey Questions?
Who's to Blame for Survey Instability: Respondents with Nonexistent Preferences or Researchers with Flawed Measures?
Inducing Sustained Creativity and Diversity in Large Language Models
Presentations
Who's to Blame for Survey Instability: Respondents with Nonexistent Preferences or Researchers with Flawed Measures? (talk at Society for Political Methodology at Michigan State University, 7/18/2026)
Who's to Blame for Survey Instability: Respondents with Nonexistent Preferences or Researchers with Flawed Measures? (talk at University of Chicago, 4/14/2026)
Who's to Blame for Survey Instability: Respondents With Nonexistent Preferences or Researchers With Flawed Measures? (talk at Bocconi University, 3/24/2026)
Who's to Blame for Survey Instability: Respondents With Random Preferences or Researchers With Flawed Measures? (talk at Johns Hopkins University, 2/12/2026)
Books
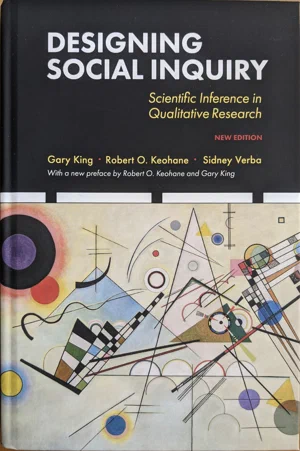


Startups
 Crimson Hexagon
🔗
Crimson Hexagon
🔗
 🔗
🔗
 🔗
🔗
 🔗
🔗
News story: “Entrepreneurial Academia with Gary King”